News · Jul 24, 2026 · Lead story
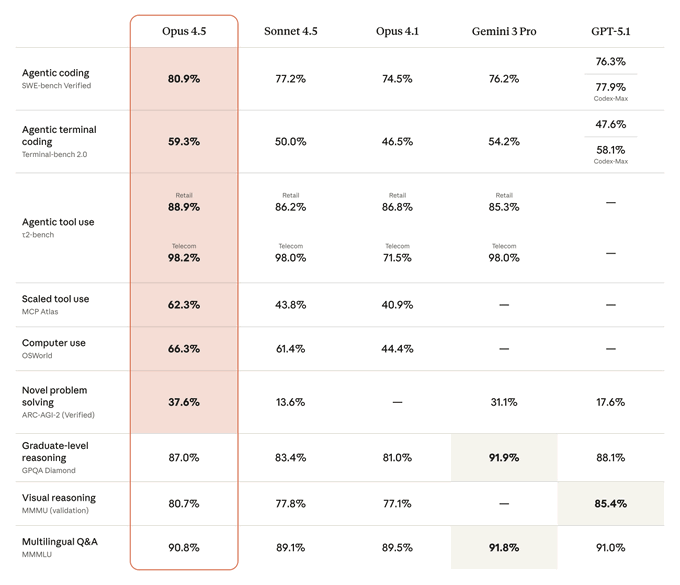
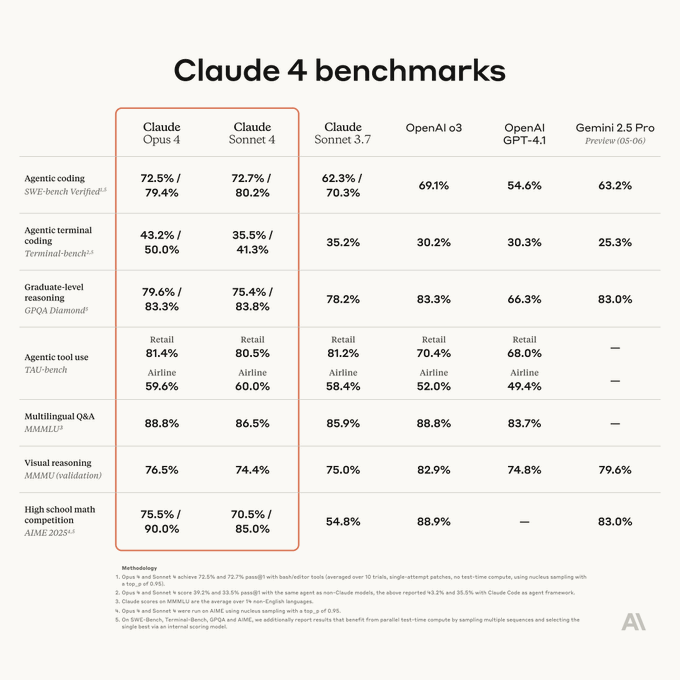
Anthropic posts Opus 5 benchmark table chart
The table chart drew 5.8M views but a 0.23% engagement rate, landing in the Wide but thin quadrant.
What happened
Anthropic posted a table chart on July 24, 2026, comparing 4 models across AI benchmarks. It was one of 5 posts from the account that day, alongside posts on novel problem-solving by cost, agentic computer use performance by effort level, and vulnerability identification and exploitation in open-source code.
The numbers
The post reached 5.8M views, #27 of 1,162 AI chart posts by views and #5 of 56 Anthropic posts. Its score of 71 ranks #195 of 1,162 AI chart posts.
The lesson
A table chart with 4 models shown drew a 0.23% engagement rate, below the 0.73% median among AI chart posts. The 5.8M views came with a 0.023% save rate.
What it means
At #24 of 56 Anthropic posts by score, this chart sits below the account's own median engagement of 0.56%. The 5.8M views against a 0.23% engagement rate show a wide but thin result.
Written by ViralChart from public numbers read on Oct 13, 2026. Every number is checked against our data before it is shown.