News · Jul 24, 2026
Anthropic charts vulnerability identification and exploitation in open-source code
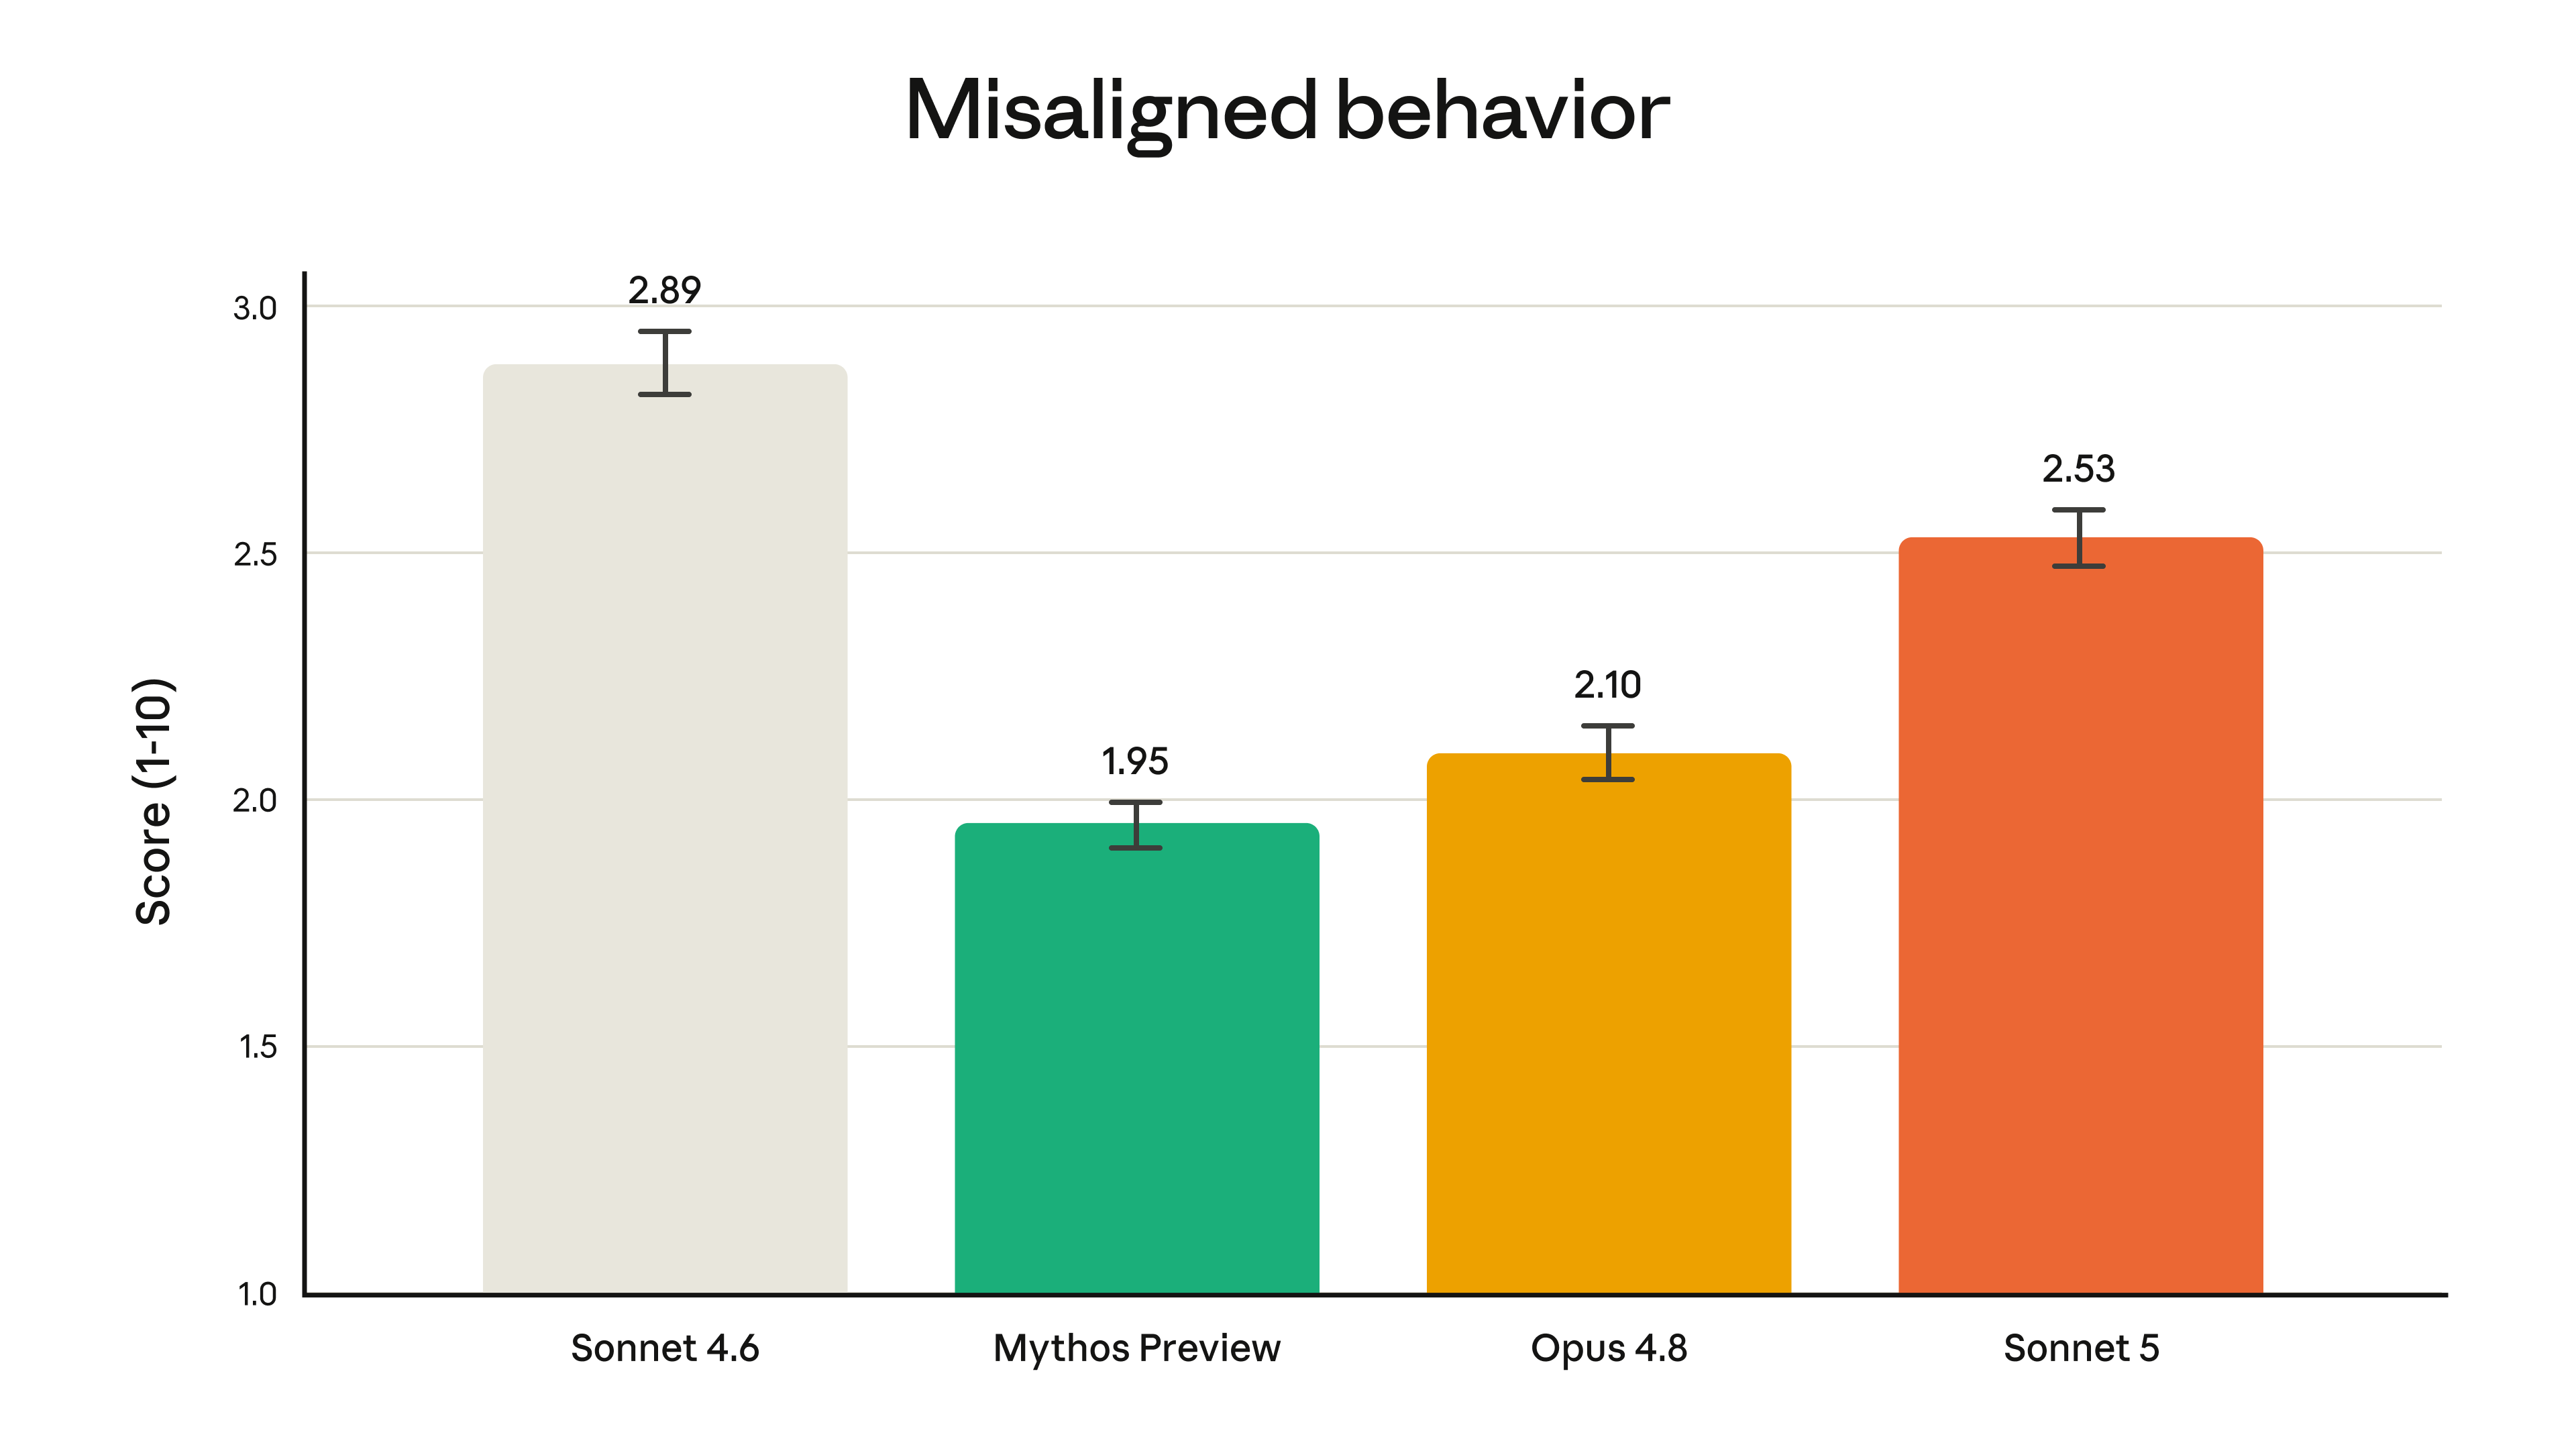
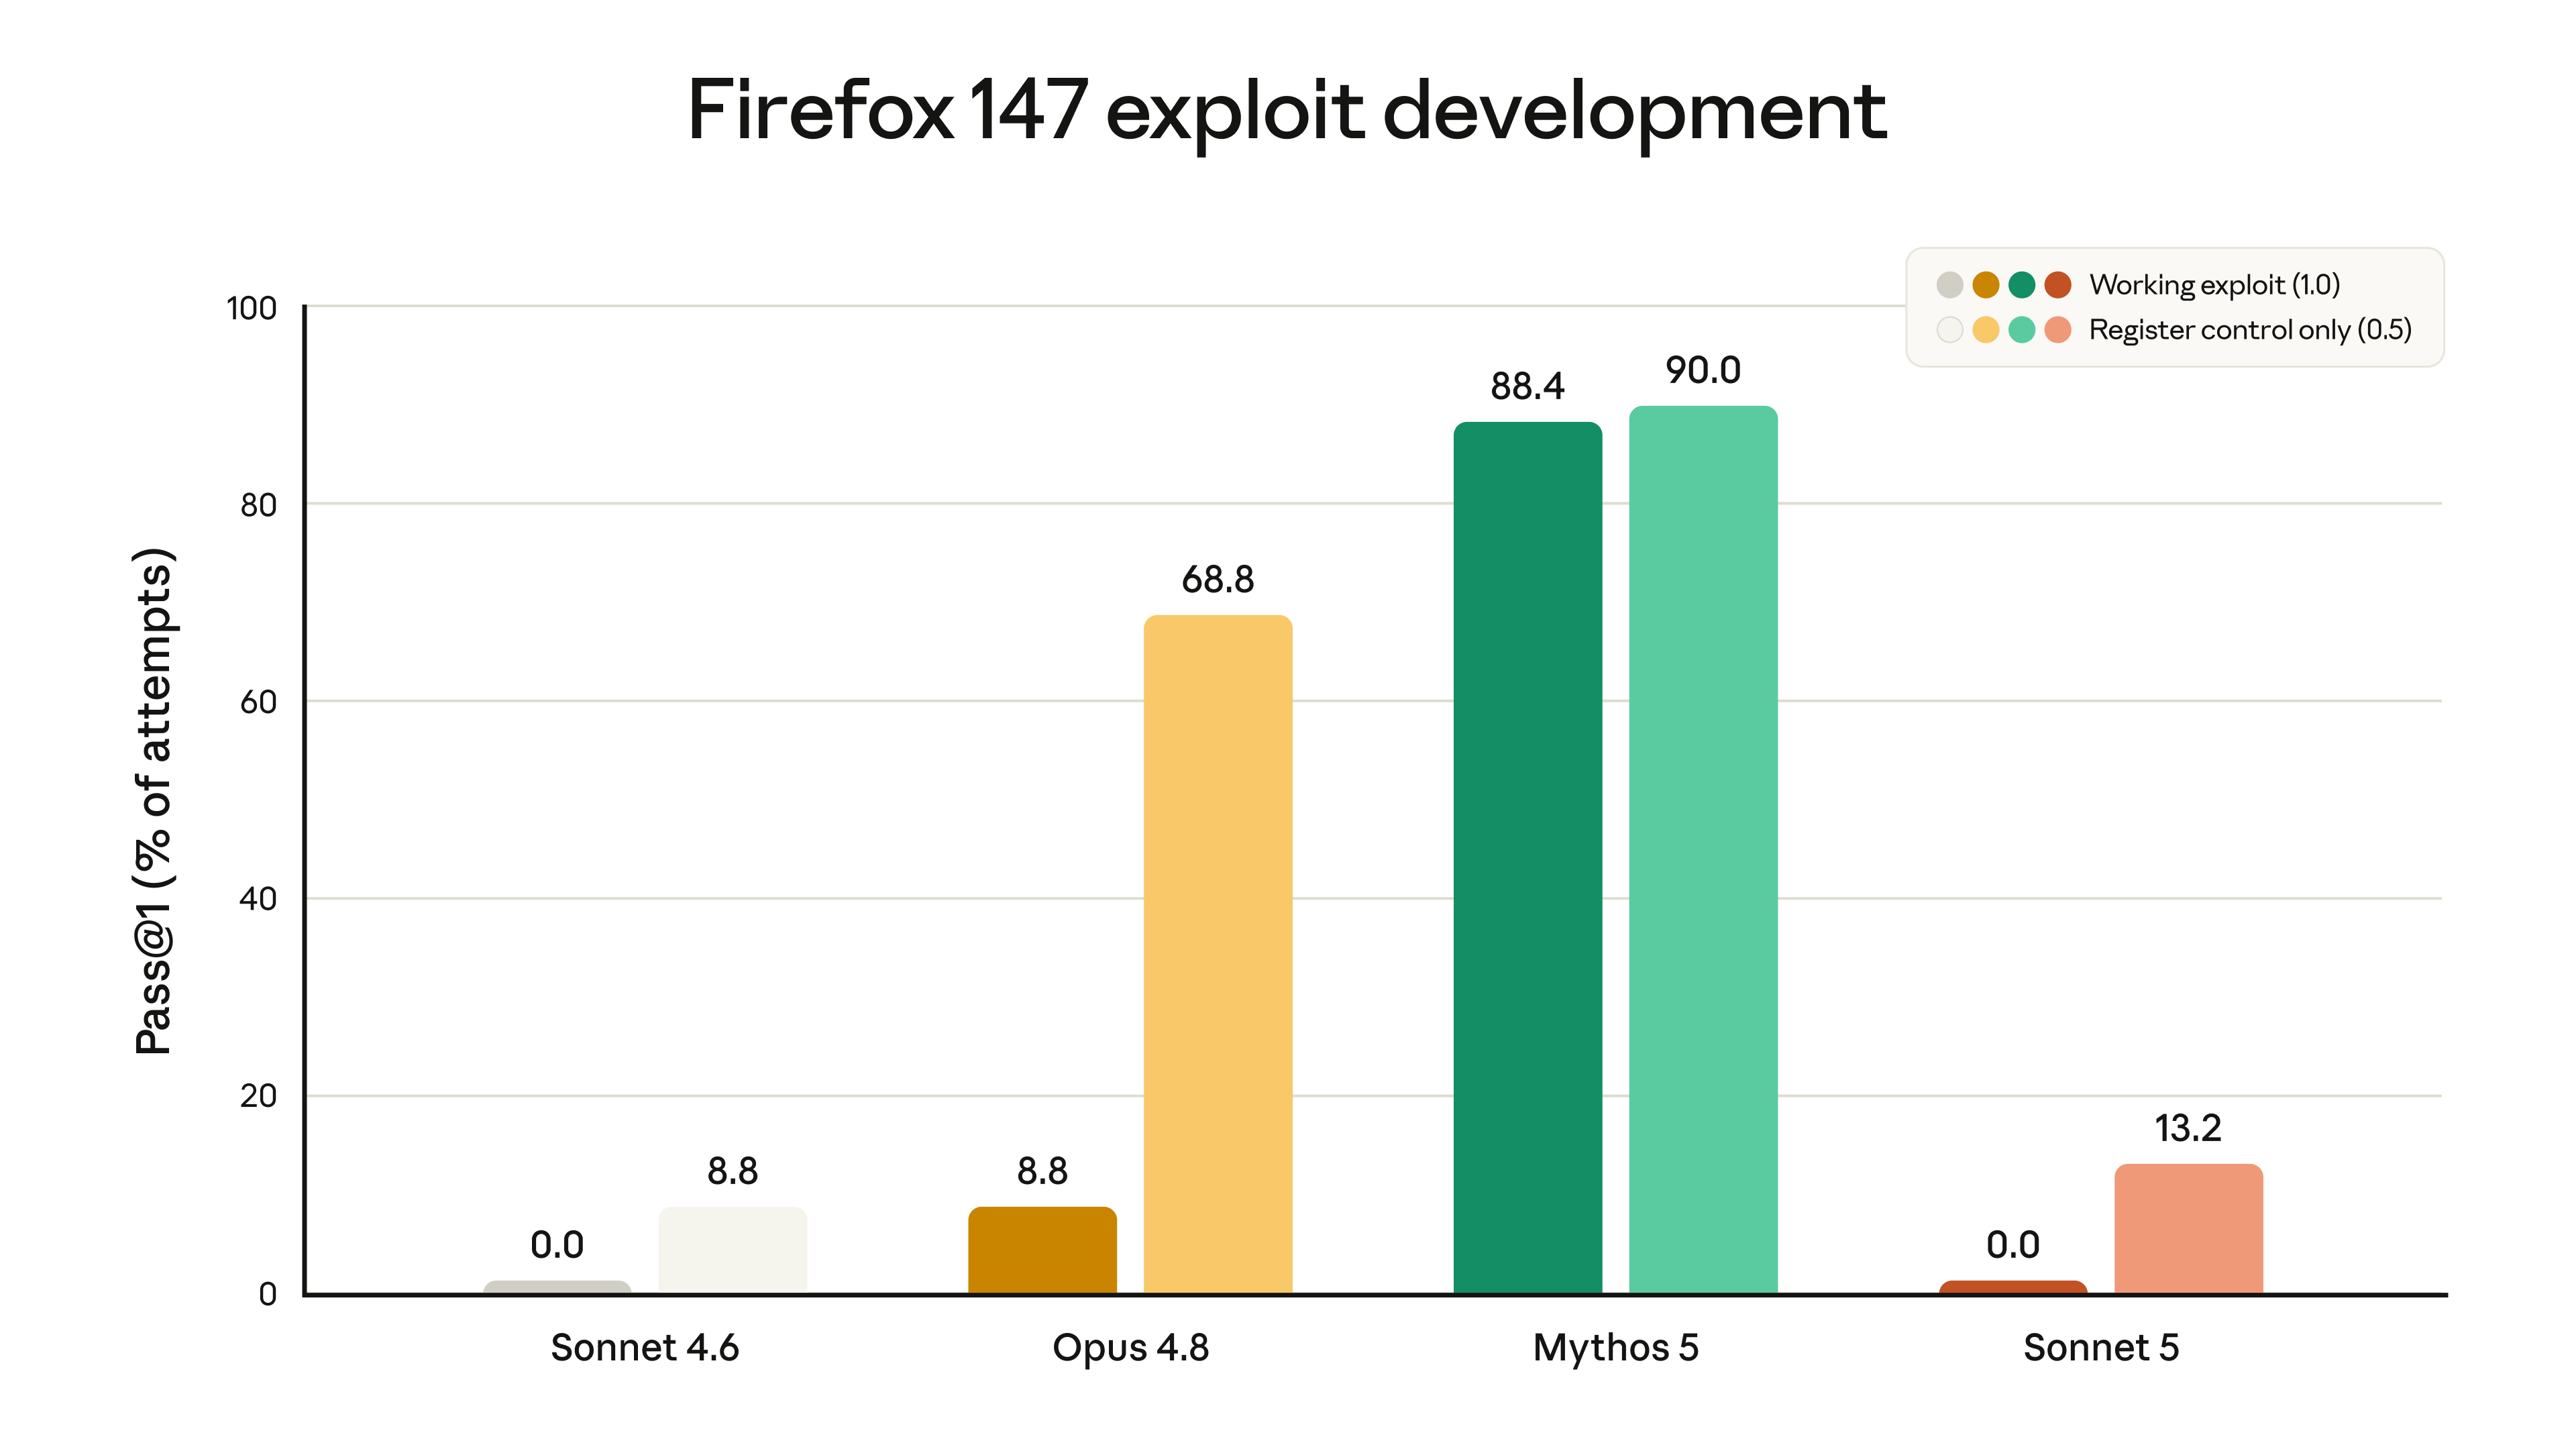
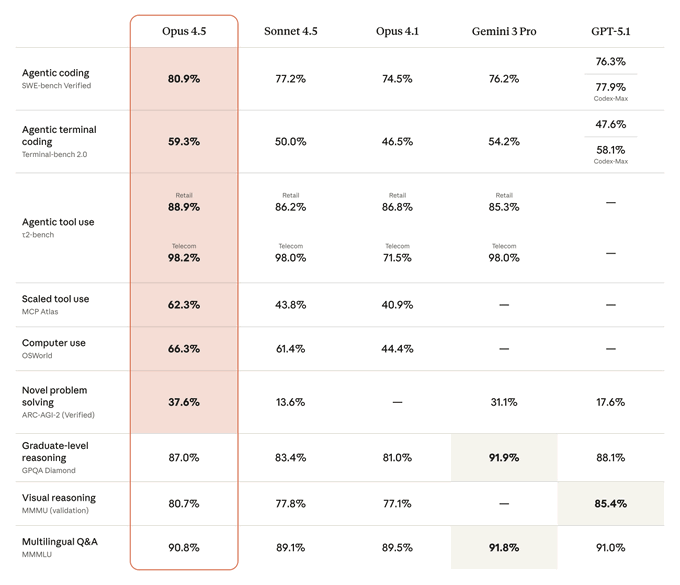
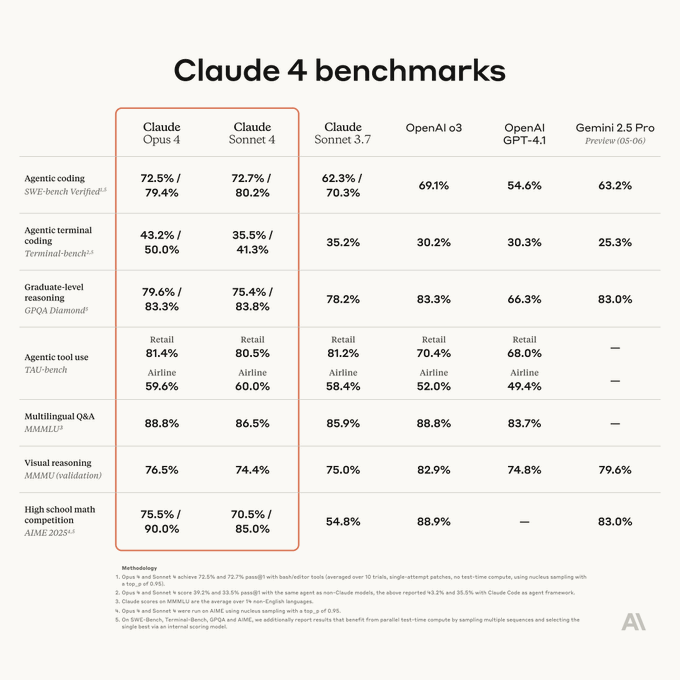
A grouped bar chart from Anthropic on July 24, 2026 drew 669K views but a 0.021% save rate, landing in the Wide but thin quadrant.
What happened
Anthropic posted a grouped bar chart on July 24, 2026 about vulnerability identification and exploitation in open-source code. It was one of 5 posts from this account that day, alongside 4 others.
The numbers
It reached 669K views, ranking #125 of 1,162 AI chart posts, against a median of 39.9K among AI chart posts. Its score of 68 ranked #264 of 1,162 AI chart posts and #32 of 56 Anthropic posts.
The lesson
A 0.021% save rate at the 10th percentile among AI chart posts shows this grouped bar chart was not kept for citation. The chart shows printed values from 0 to 80 across vulnerability identification and exploitation success.
What it means
At #32 of 56 Anthropic posts, this chart sits in the middle of the account's own output while its save rate lands in the bottom decile among AI chart posts. The 669K views against a 39.9K median among AI chart posts mark wide reach with thin engagement.
Written by ViralChart from public numbers read on Oct 13, 2026. Every number is checked against our data before it is shown.