News · May 22, 2025
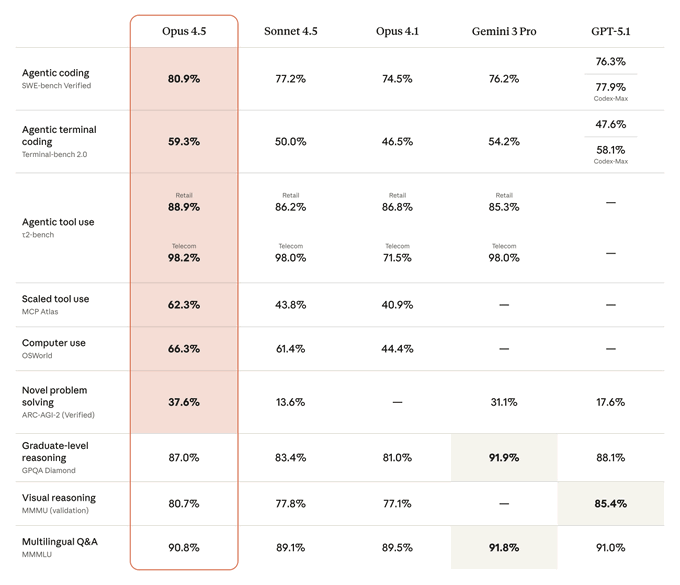
Anthropic posts Claude 4 benchmark table chart
The table chart reached 4.3M views and a 0.60% engagement rate, landing in the Wide but thin quadrant.
What happened
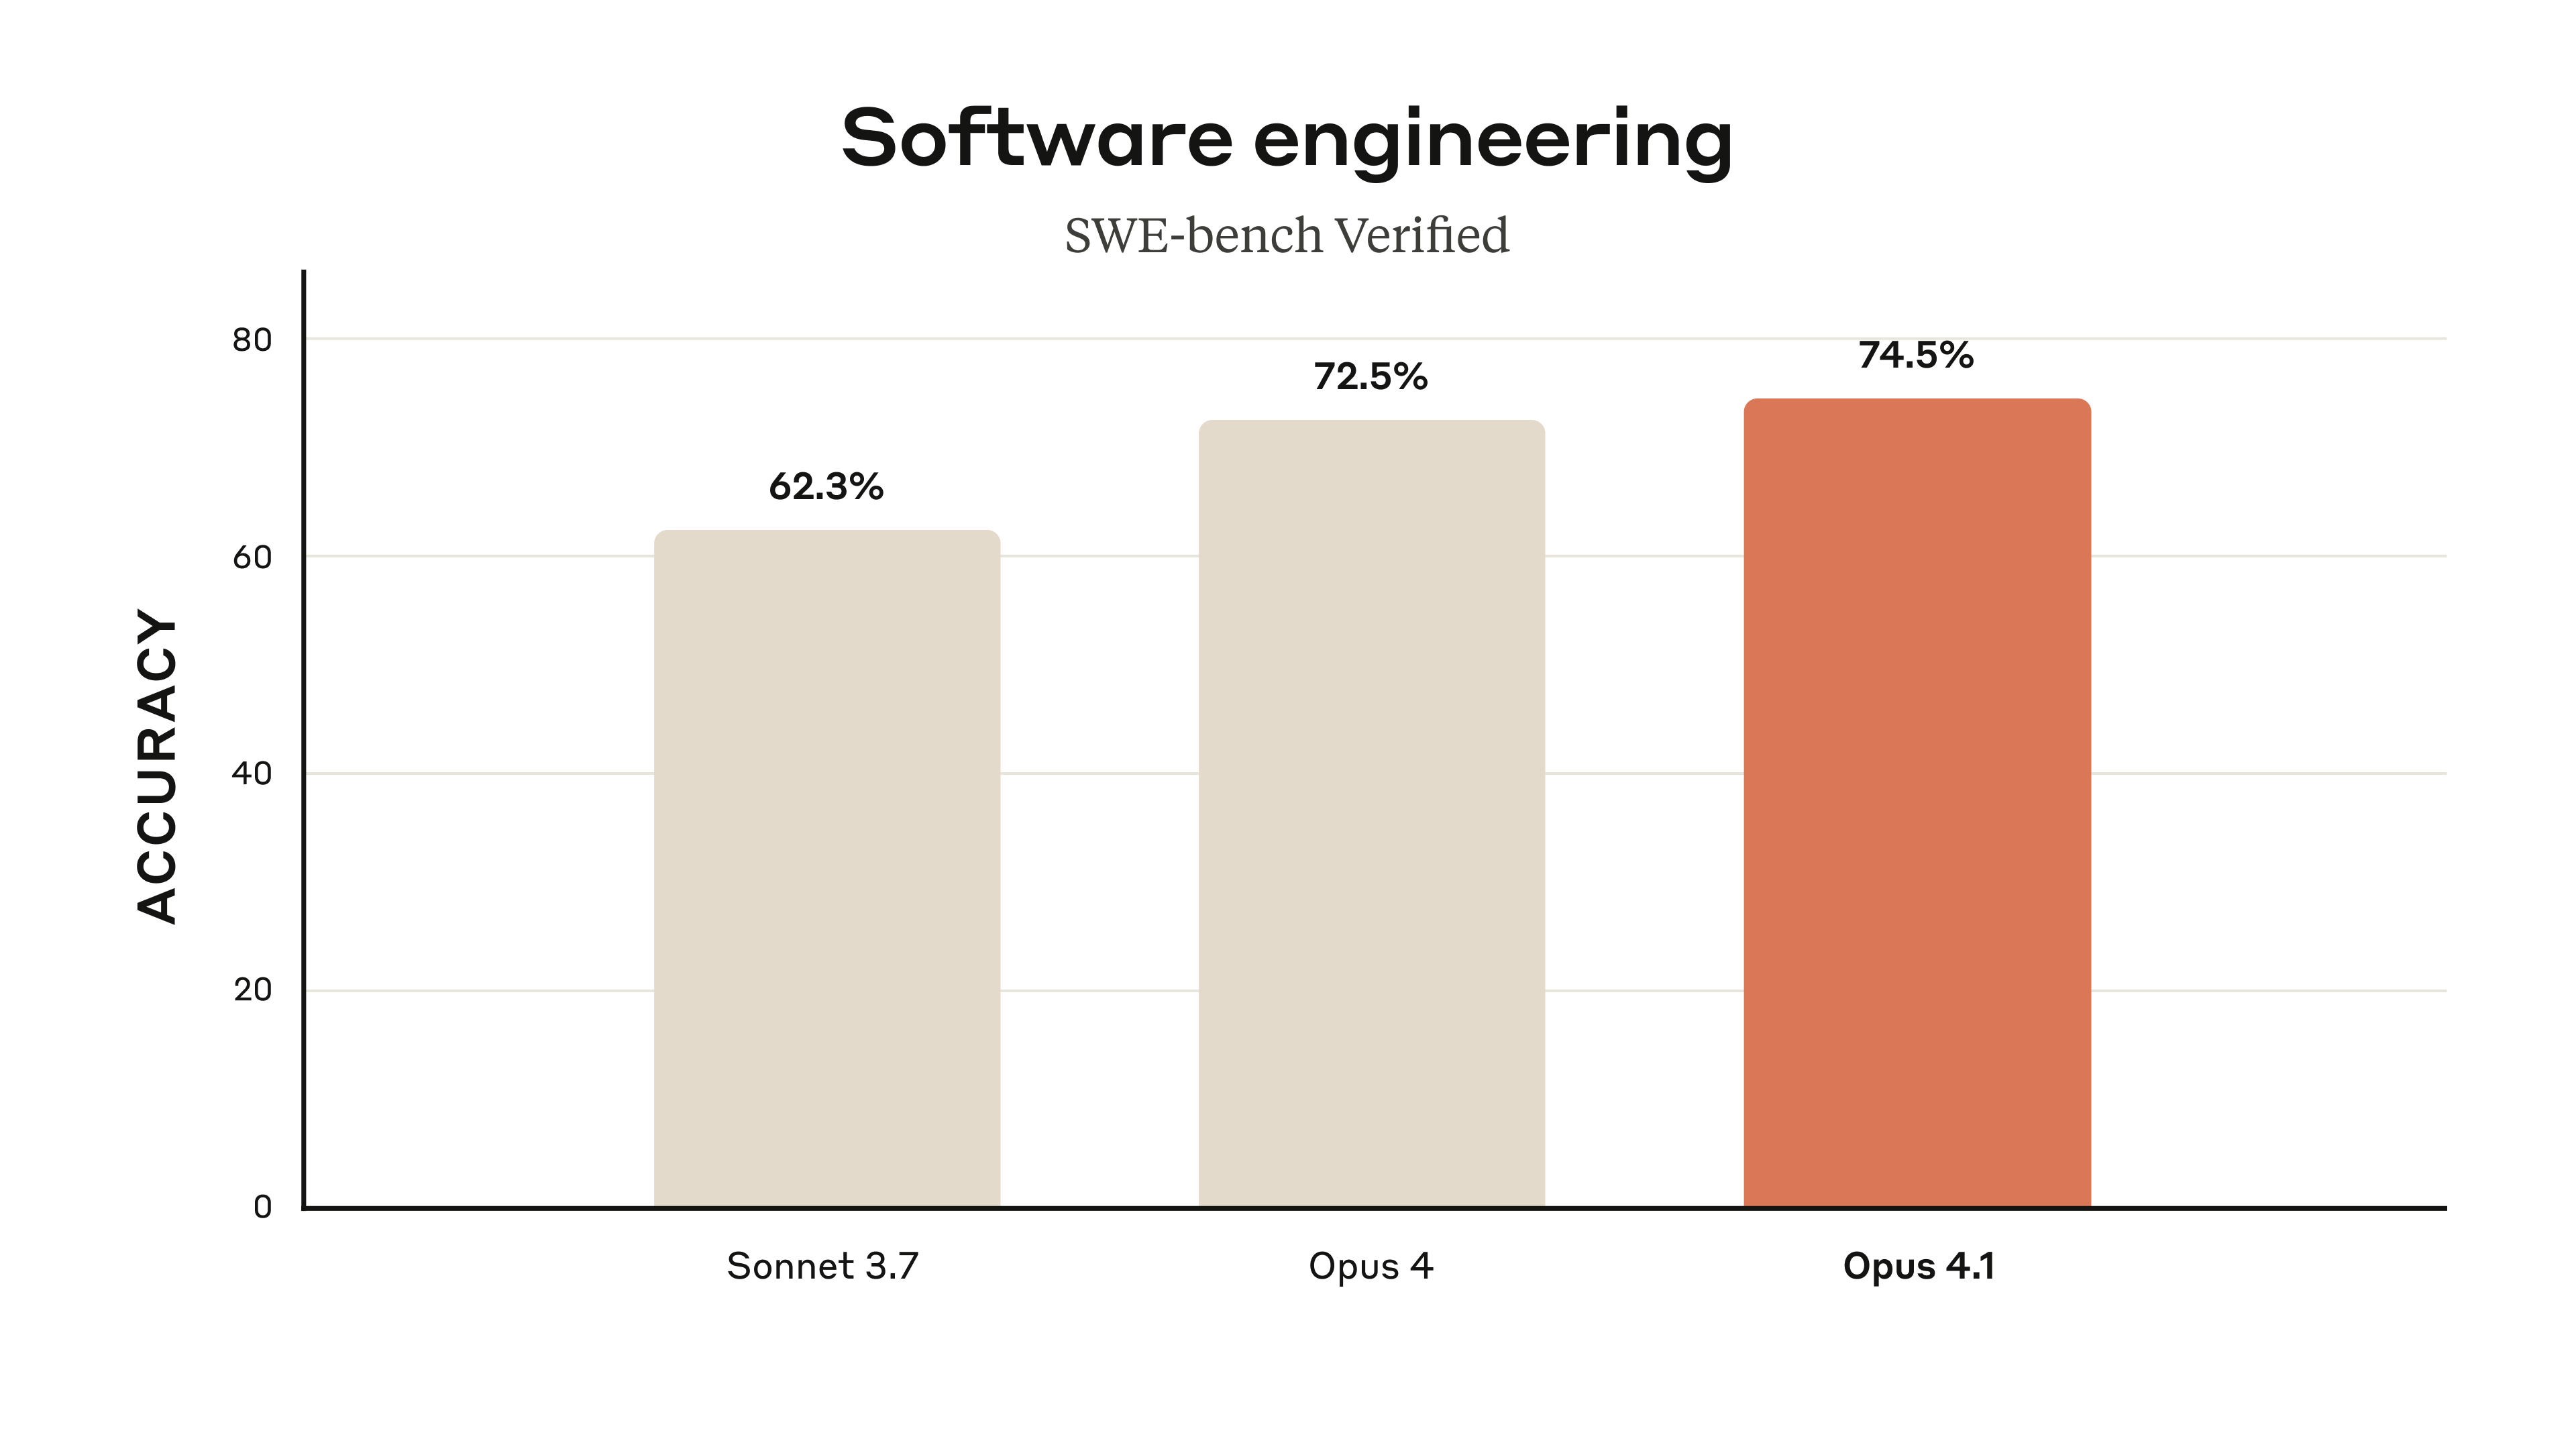
Anthropic posted a table chart on May 22, 2025 comparing Claude 4 benchmarks. That day the account posted 2 posts, including one on Software engineering SWE-bench Verified with 131K views.
The numbers
It drew 4.3M views, #36 of 1,162 AI chart posts, and a score of 82, #27 of 1,162 AI chart posts. Among Anthropic posts it ranks #3 of 56 by score and #7 of 56 by views.
The lesson
A table chart with 6 models shown drew 4.3M views, 10x Anthropic's 431K median, but a 0.60% engagement rate and 0.080% save rate sit below the AI chart median.
What it means
At #3 of 56 Anthropic posts by score, this table chart trails the account's own top posts, and its 0.60% engagement rate against 4.3M views shows the gap between reach and interaction.
Written by ViralChart from public numbers read on Oct 13, 2026. Every number is checked against our data before it is shown.