News · Jul 24, 2026
Anthropic's agentic workflow line chart draws 1.4M views
The July 24, 2026 post reached 1.4M views but saved at 0.018%, an 8th percentile rate among AI chart posts.
What happened
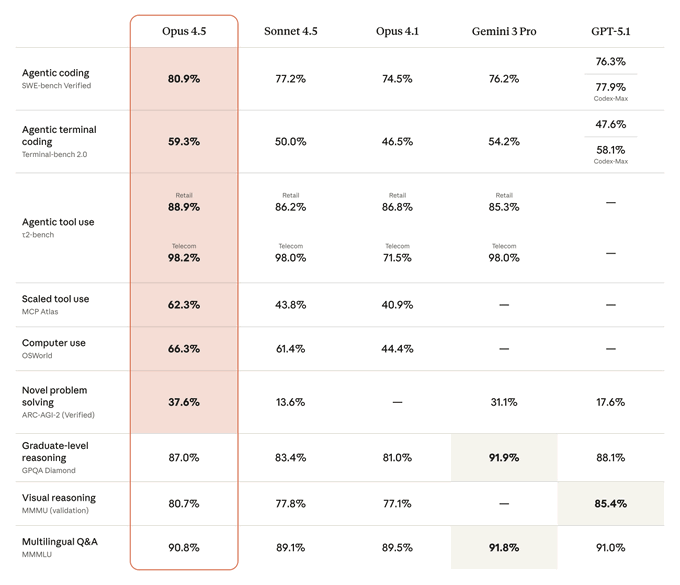
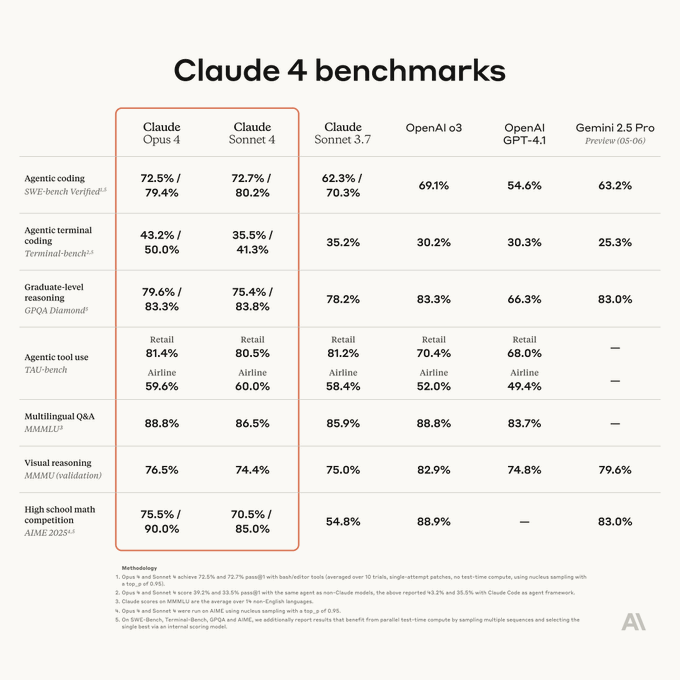
Anthropic posted a line chart on agentic business automation workflows by effort on July 24, 2026, with 3 charts in the post. That day the account published 5 posts, including AI Model Benchmark Comparison at 5.8M views.
The numbers
It reached 1.4M views, #81 of 1,162 AI chart posts and #17 of 56 Anthropic posts. Its score of 68 ranks #260 of 1,162 AI chart posts.
The lesson
A save rate of 0.018% against a 0.076% median among AI chart posts shows this line chart was read, not kept. The 4 models shown and 3 charts in the post sit with a bottom decile save rate.
What it means
At #30 of 56 Anthropic posts, this chart sits mid-pack for the account while its 1.4M views run 3.3x the 431K company median. The 0.018% save rate against a 0.076% median marks the gap between views and keeps.
Written by ViralChart from public numbers read on Oct 13, 2026. Every number is checked against our data before it is shown.