News · Apr 23, 2026
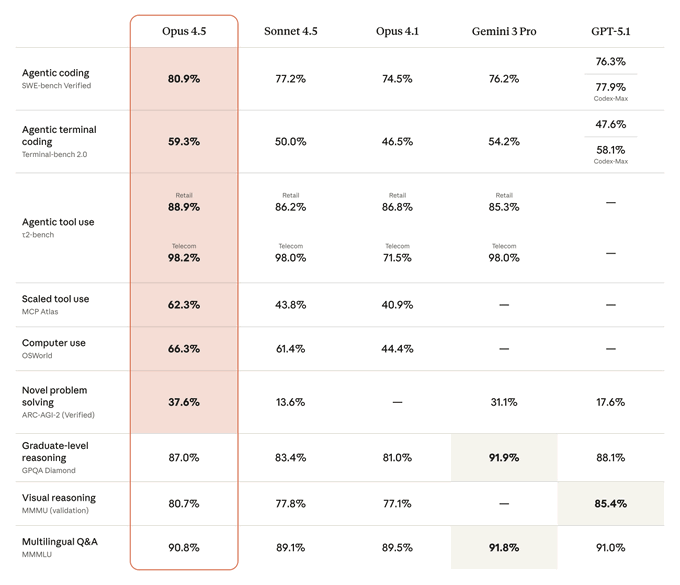
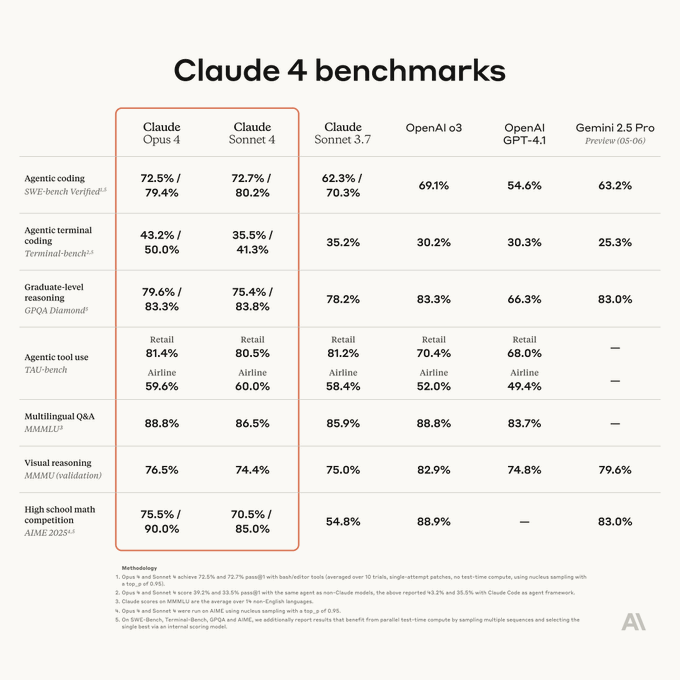
@OpenAIDevs posts AI model benchmark comparison table
A 6-model table chart drew 61.7K views and a 1.60% engagement rate, above the 0.73% median among AI chart posts.
What happened
@OpenAIDevs published a table chart on April 23, 2026 comparing AI model performance across multiple benchmarks. It was the account's only post that day.
The numbers
It reached 61.7K views, ranking #483 of 1,162 AI chart posts, and scored 69, ranking #254 of 1,162 AI chart posts.
The lesson
A 1.60% engagement rate at the 94th percentile came with a 0.096% save rate. The table drew likes and replies at a top-decile rate while saves stayed near zero.
What it means
At #1 of 2 @OpenAIDevs posts, this is the account's top-scoring chart post. Its 0.14 views per follower sits below the 0.20 median, so reach ran under the follower base even as engagement ran above the AI chart median.
Written by ViralChart from public numbers read on Oct 12, 2026. Every number is checked against our data before it is shown.