- Giants
- Datawrapper
- Debate social media sentiment

Debate social media sentiment
Datawrapper's scatter plot drew 1.8K views on X: 1.8x its typical post and #2 of 3 Datawrapper charts we track by views. Read Oct 22, 2026.
This week's Data Vis Dispatch covers protests in India 📢🇮🇳, the effects of AI on the U.S. stock market 🤖, work friendships 👥, Amazon’s high seller fees 📈, and taxing the ultra-rich 💵. Explore these topics and much more in the newly p
Why it spread
It spread because an unusual chart type that explains itself earned 32 likes, 3 reposts, 17 saves and 1,782 views, with a quote rate in the bottom quarter and source reach in the top quarter.
What worked
- The chart type is unusual, which makes people stop and look.
- The chart explains itself, so viewers get the point without extra text.
- The post is tied to a timely roundup of topics, which gives people a reason to save and share it.
What to borrow
We could try an unusual chart form for one of our own datasets and label it so clearly that it explains itself, then wrap it in a timely roundup post.
Careful
Do not over-read the spread: quotes were zero62 and the quote rate sits in the bottom quarter, so this is not a debate-driving post, and the account's typical performance is unknown.
Written by our analysis model from the measured numbers above, not by Datawrapper.
Make it yours
We have not read this chart's numbers yet
Its own maker appears here once its numbers are read. Until then, these are other real charts in a similar format: each data page starts from that chart's numbers and takes yours.
API
Not in the API yet
We have not read this chart's numbers yet, so the API has nothing to return for it. Charts with numbers read are on the data page, and each one can be called by id.
More from Datawrapper
All 3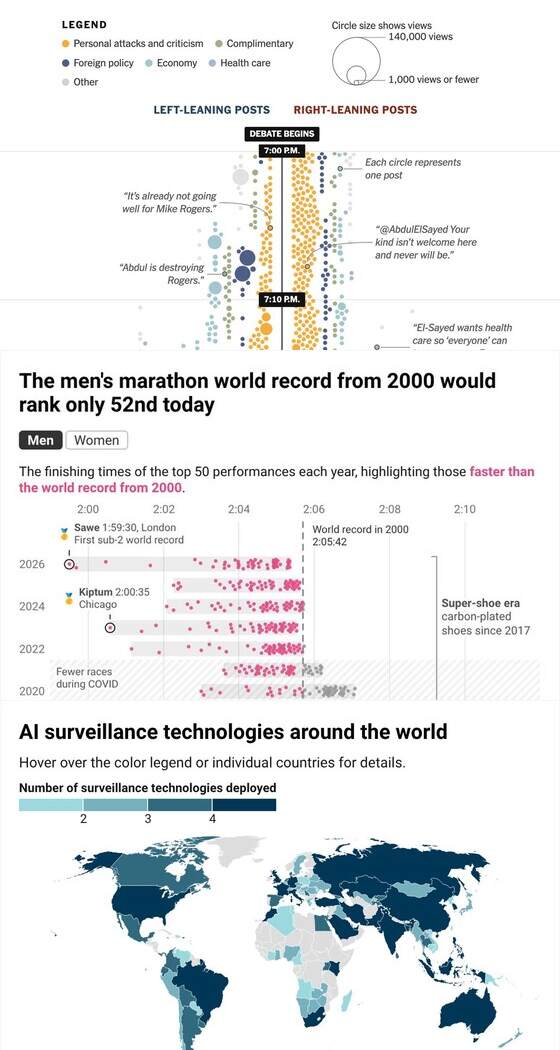
Other giants using a scatter plot
All 103



Questions people ask
How far did Datawrapper's "Debate social media sentiment" chart travel?
1,782 views, 32 likes, 3 reposts and 17 saves on X, read Oct 22, 2026. A normal post from @Datawrapper gets about 995 views.
What kind of chart is it?
A scatter plot. Social media posts during debate show sentiment split by party.
Can I use Datawrapper's chart?
Use the format, not the picture. The chart, logo and design belong to Datawrapper. ViralChart redraws the chart type with your numbers and words, and credits the original publisher.