- Giants
- Datawrapper
- Global AI surveillance

Global AI surveillance
Datawrapper's choropleth map drew 872 views on X: 0.9x its typical post and #3 of 3 Datawrapper charts we track by views. Read Oct 11, 2026.
AI might be watching you. 👁️ Where is surveillance tech most common, and what role does the state of democracy play? Our Dispatch curator Michelle charted the answers. 🤳 🚨
Why it spread
It spread because an independent author made a choropleth showing AI surveillance technologies deployed by country, backed by a big source, and it reached 872 views with 9 likes, 1 repost, 0 quotes and 2 saves.
What worked
- The post pairs a serious topic with a clear question about where surveillance tech is most common and what role democracy plays.
- The chart is a choropleth that shows AI surveillance technologies deployed by country, a form that fits geographic comparison.
- It credits an independent author and draws on a big source, and it includes a source line.
What to borrow
We could take a timely, slightly unsettling topic and map it by country as a choropleth, then point readers to a longer write-up for context.
Careful
Do not over-read the low engagement: 9 likes, 1 repost, 0 quotes and 2 saves on 872 views is modest, and the quote rate sits in the bottom quarter, so the spread was likely driven by the topic and source rather than by the design.
Written by our analysis model from the measured numbers above, not by Datawrapper.
Make it yours
Your numbers, in a look-alike of the original.
Starts from the real numbers of "AI surveillance technologies around the world" by Datawrapper. Replace every number with yours before you post. Make one like this, step by step
Drawn from this chart's own series and categories in its layout. Original colours shows the publisher's palette. Free pictures carry a small "Made with ViralChart" line.
API · Max
Use this chart via API
On the Max plan you can pull this chart's numbers with the provenance of each one, as JSON or CSV, with its redraw spec, or call it from an agent over MCP. Chart id 4001307f100a.
| Path | Returns | Plan | |
|---|---|---|---|
| GET | /api/v1/charts/4001307f100a | Title, publisher, date, form, point count; with a Max key, the data link | Open |
| GET | /api/v1/charts/4001307f100a/data | Every point with its provenance and confidence, plus the redraw spec. Add ?format=csv for CSV | Max |
| GET | /api/v1/charts/4001307f100a/render?view=1 | The draw-only view this page uses | Open |
| POST | /mcp | Tool get_chart_data with this id, for Claude, Cursor and other agents | Max |
curl -s https://viral-chart.com/api/v1/charts/4001307f100a/data \
-H "Authorization: Bearer $VIRALCHART_KEY"claude mcp add --transport http viralchart https://viral-chart.com/mcp \
--header "Authorization: Bearer $VIRALCHART_KEY"60 requests a minute per key; over that you get 429 with Retry-After. Up to 5 keys per account, made on your account page and shown once. Without Max, the data route answers 402 with a link to the plans. The numbers describe a chart its publisher owns, and every file carries a license note.
More from Datawrapper
All 3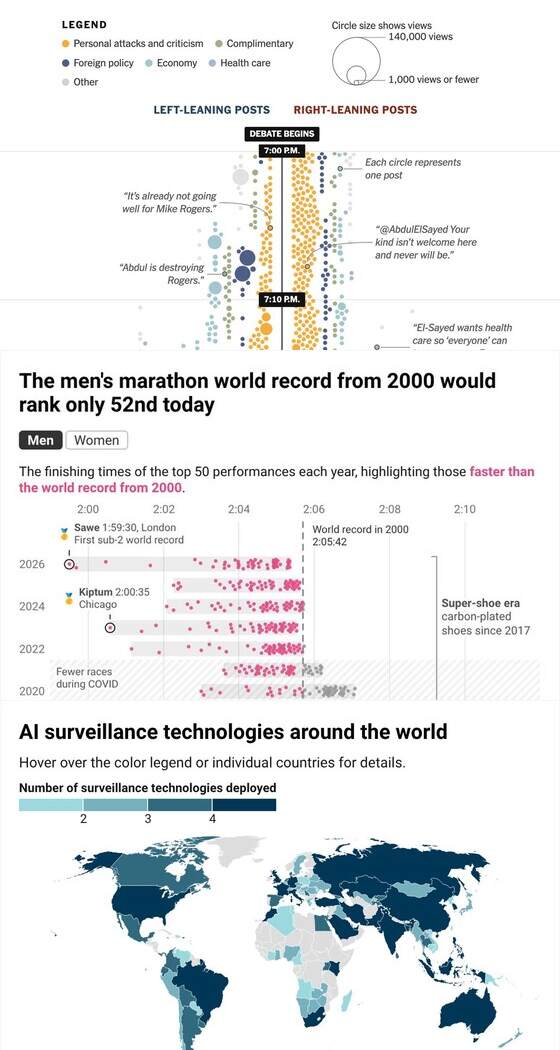
Other giants using a choropleth map
All 25


Questions people ask
How far did Datawrapper's "Global AI surveillance" chart travel?
872 views, 9 likes, 1 reposts and 2 saves on X, read Oct 11, 2026. A normal post from @Datawrapper gets about 995 views.
What kind of chart is it?
A choropleth map. AI surveillance technologies deployed by country.
Can I use Datawrapper's chart?
Use the format, not the picture. The chart, logo and design belong to Datawrapper. ViralChart redraws the chart type with your numbers and words, and credits the original publisher.