- Giants
- Datawrapper

Chart stats · Data publishers
Datawrapper
@datawrapper
Datawrapper posted 3 charts we track since Oct 2026, 5.3K views in all. The furthest, "Men's marathon world record", drew 2.7K views. #23 of 37 giants by attention index.
Free with your email
See Datawrapper's full chart stats
Every chart Datawrapper posted, the timeline, the outliers and why each one spread. Plus Monday's email: the week's charts that beat their usual likes.
Unlocks all 37 giants. One email a week, leave any time. What you get · Log in
Views gained
Views on the charts we tracked, counted on the day each chart was posted. A gap means we hold no chart from that week, not that they posted none.
Every chart, over time
Each dot is a chart: higher means more views, bigger means more likes than their usual post. Bright dots got 3x or more. Tap a dot to open it.
Views against the likes outlier
Right means more views; up means more likes than this account's usual post. The lines are their own medians, so every giant is judged against itself.
Latest charts
Oct 20, 2026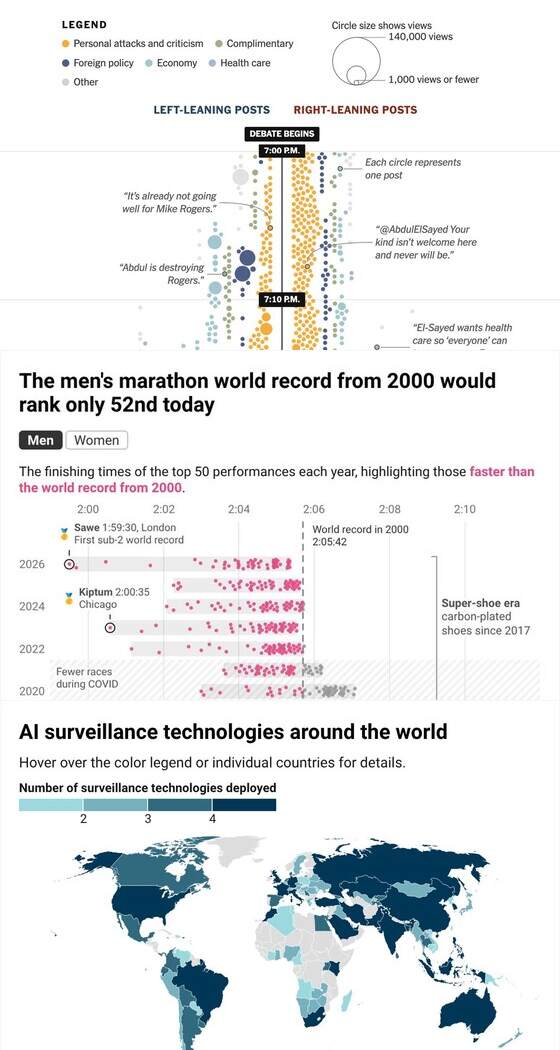
Similar giants


Questions people ask
How often does Datawrapper post charts?
About 0.2 a week over the last 90 days. We have tracked 3 charts since Oct 2026; the latest is from Oct 20, 2026.
Which Datawrapper chart went furthest?
"Men's marathon world record" (Oct 2026): 2,683 views and 33 likes.
What chart type does Datawrapper use most?
Scatter plot (2), Choropleth map (1)
What is the attention index?
Attention index: 0 to 100 from up to five measured signals with fixed anchors (median views 1K to 10M, median outlier (likes against their usual post) 0.3x to 10x, saves per view 0 to 1%, charts a week 0 to 5, share of 3x breakouts 0 to 50%). Missing signals are left out and the score is pulled toward 50.