News · Feb 5, 2026 · Lead story
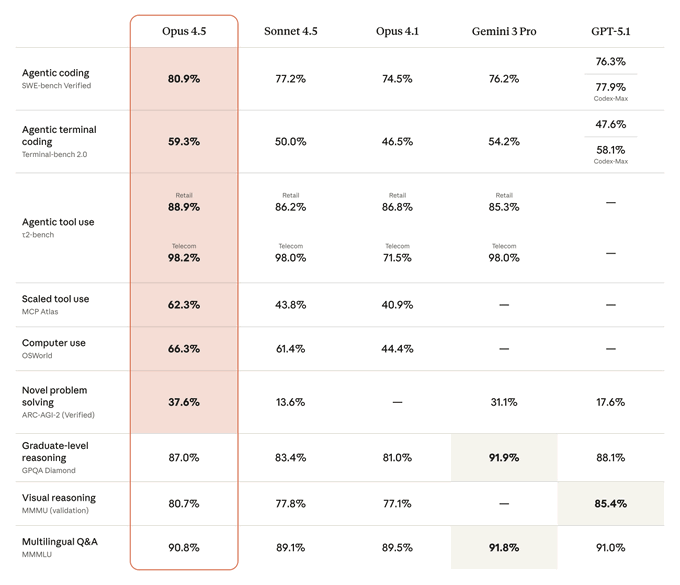
Anthropic posts AI model benchmark comparison table chart
Anthropic's February 5, 2026 table chart drew 752K views, 1.7x its own median, but engagement stayed below the AI chart median.
What happened
Anthropic, an official account, posted a table chart on February 5, 2026, comparing AI model performance across benchmarks. It was the account's only post that day.
The numbers
The post reached 752K views, ranking #115 of 1,162 AI chart posts and #21 of 56 Anthropic posts. Its score of 77 ranks #97 of 1,162 AI chart posts.
The lesson
A table chart with 5 models shown drew 752K views against a 133K median for table charts, a 5.6x gap, while engagement of 0.62% sat near the 0.61% median for the type.
What it means
For Anthropic, 752K views is 1.7x its 431K median, but the 0.62% engagement rate places the post below the AI chart median, so wide reach did not carry engagement.
Written by ViralChart from public numbers read on Oct 13, 2026. Every number is checked against our data before it is shown.