
o3 benchmarks and performance, in charts
Every chart we tracked that shows o3, from the lab itself and from the trackers people trust, with how far each one travelled.
Official charts from OpenAI
As published on X, Hugging Face, GitHub and their blog. Each card opens our own page for the chart.


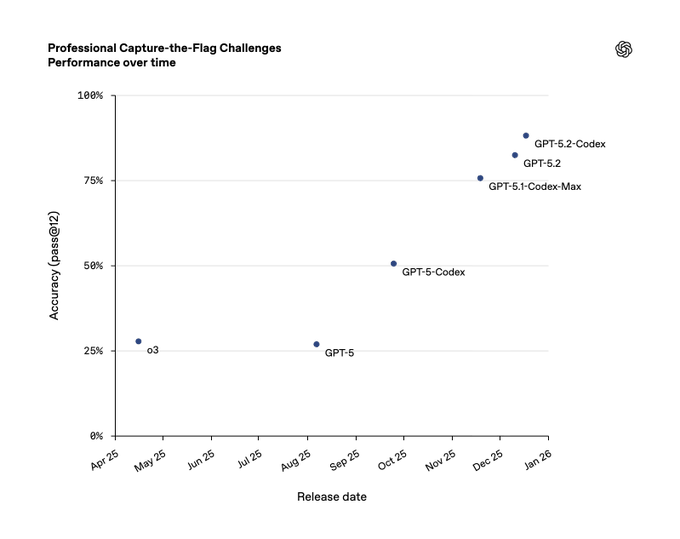

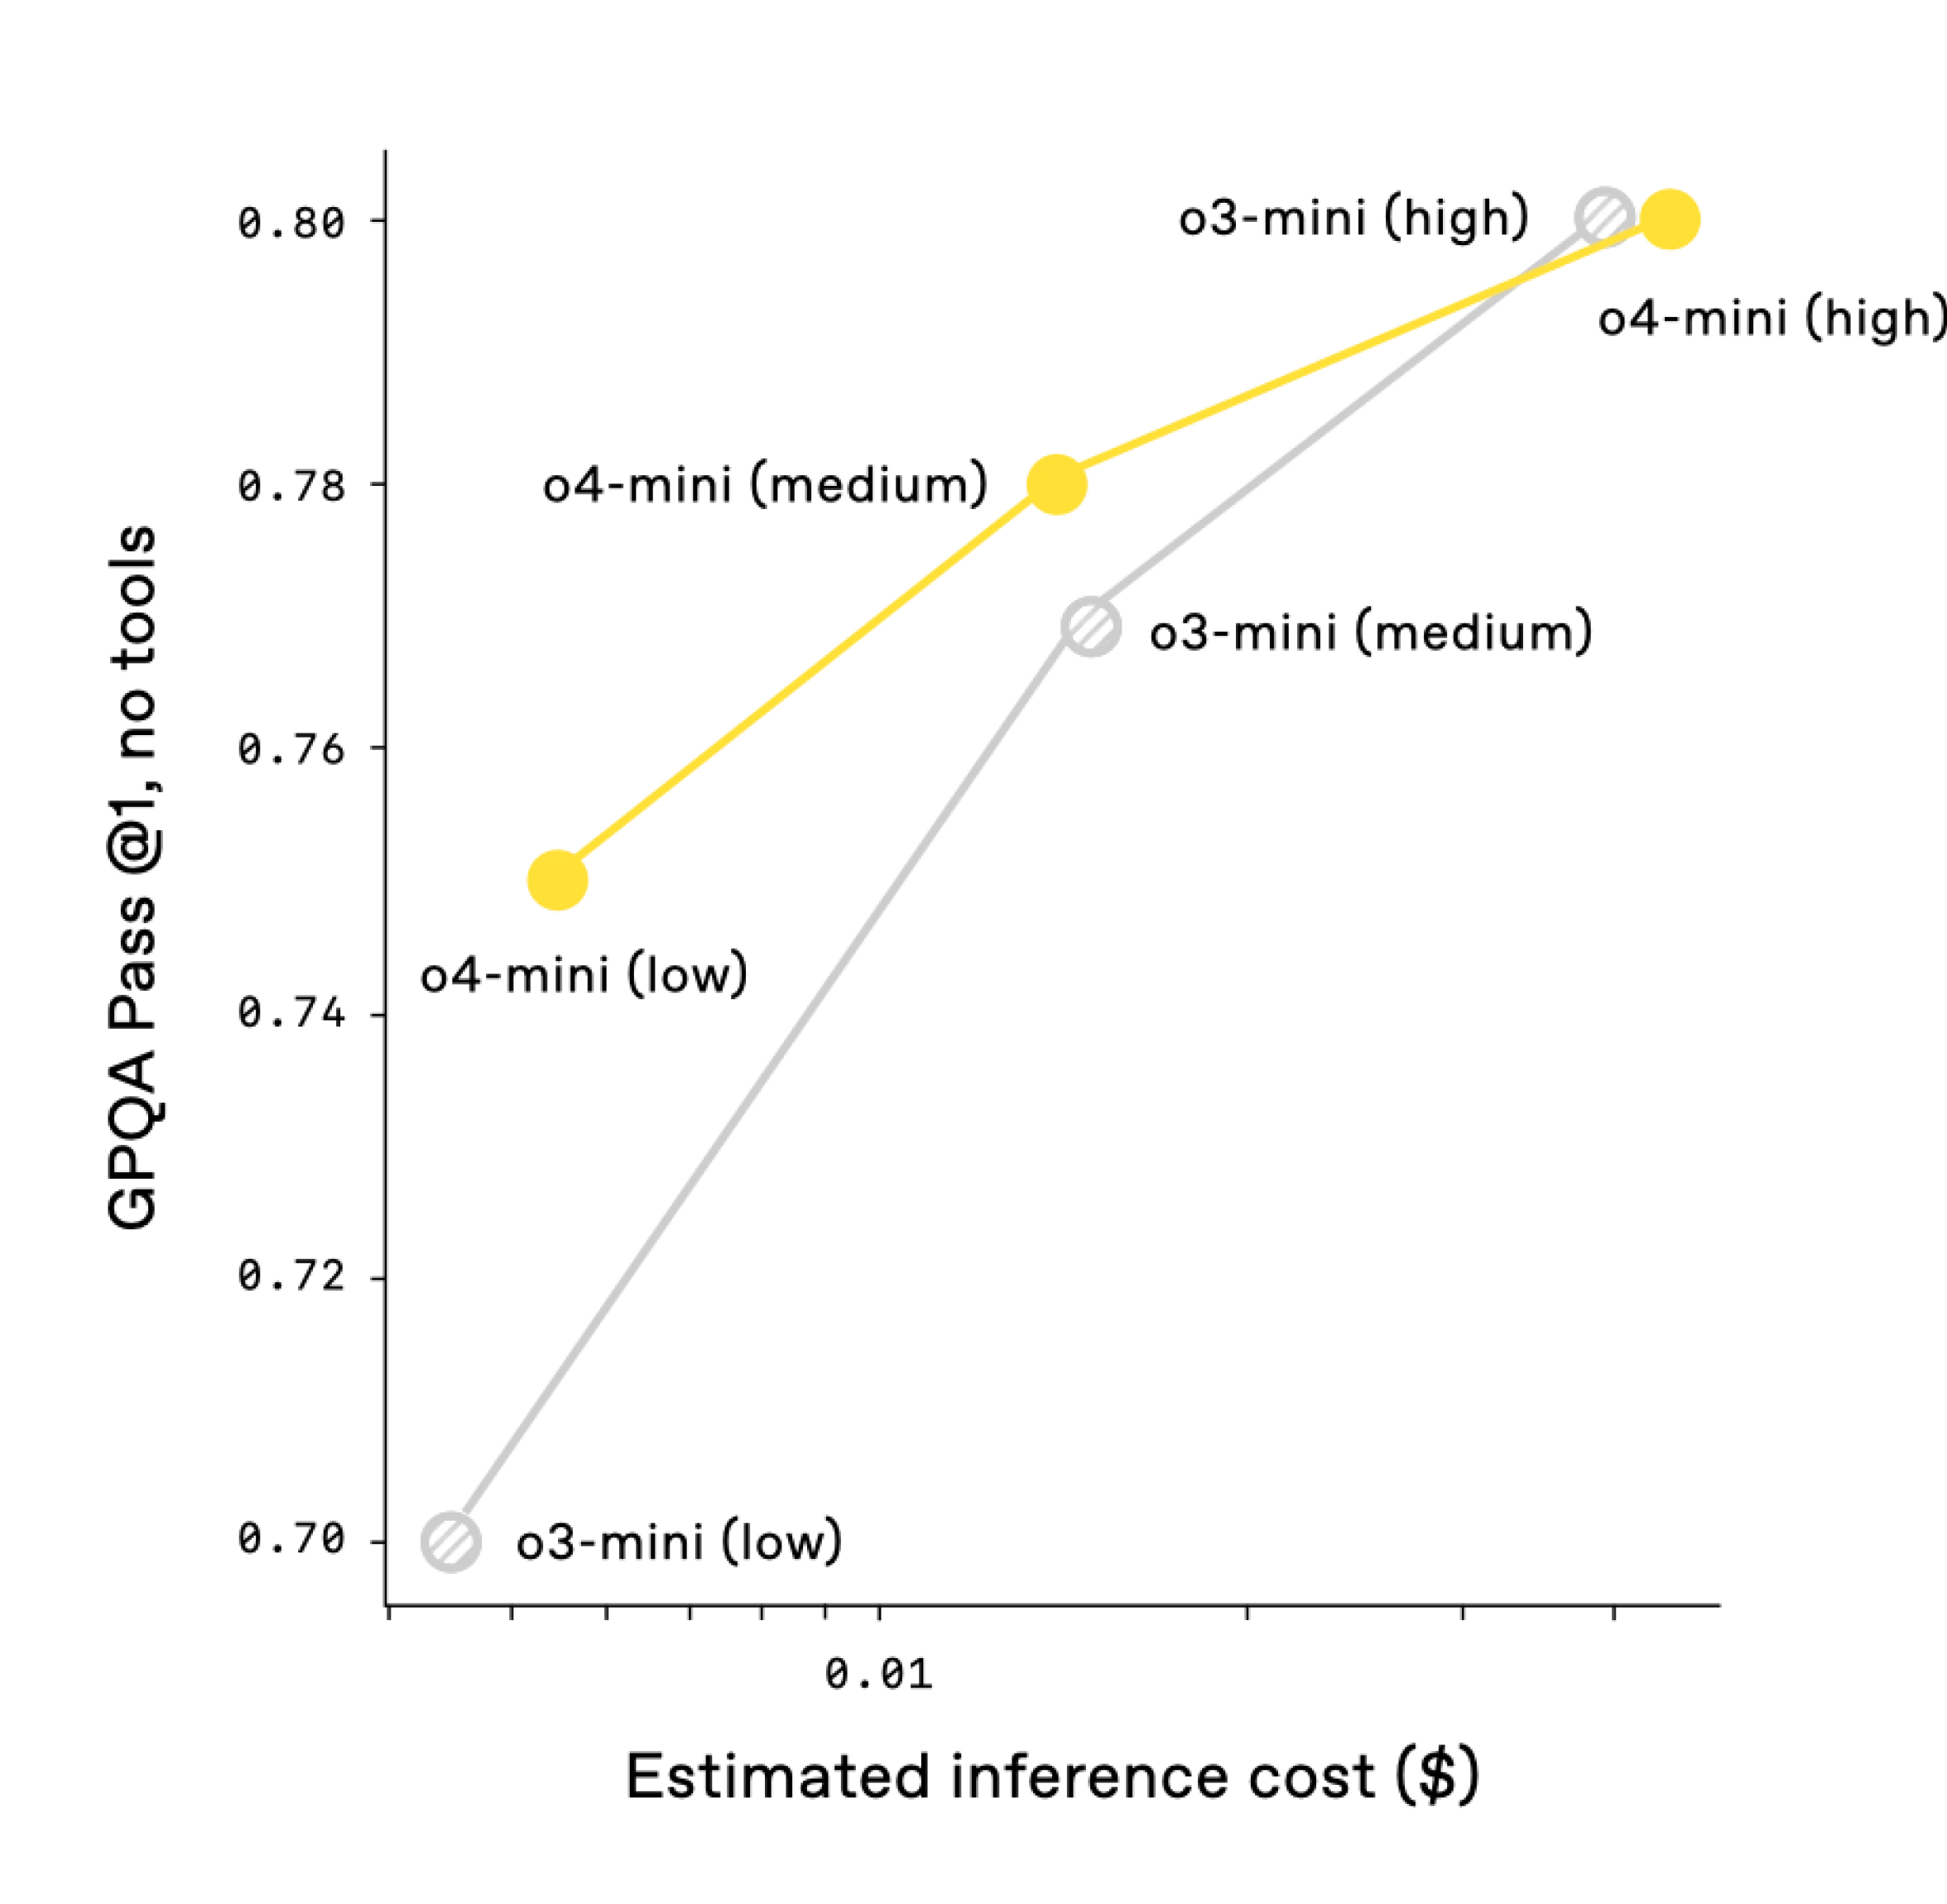


From benchmark trackers and others


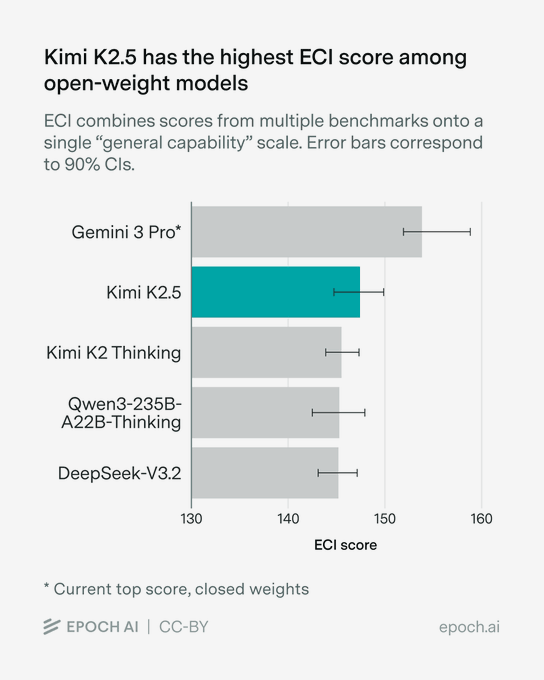


More charts that feature o3
Benchmark trackers, other labs and researchers. Each card opens our own page for the chart.


Free with your email
See all 44 o3 charts
Every official launch chart and independent benchmark we found for o3, with who posted each one. Plus Monday's email: the week's charts that beat their usual likes.
Unlocks all 35 giants. One email a week, leave any time. What you get · Log in
More charts that feature o3 more


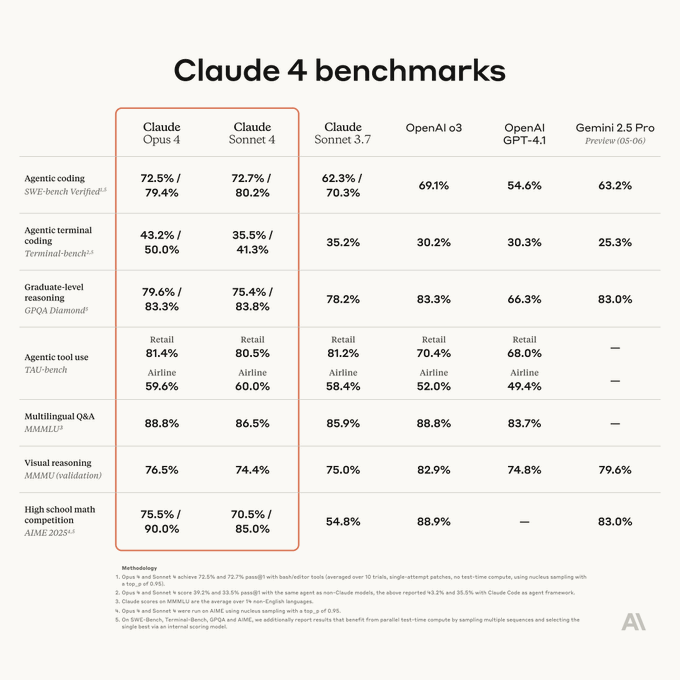


Make it yours
Your numbers, in a look-alike of the original.
Starts from the real numbers of "Accuracy / Percentile (%)" by deepseek. Replace every number with yours before you post. Make one like this, step by step
Look-alike score 8.3 of 10. Free pictures carry a small "Made with ViralChart" line. That line is how other people find us.
Questions people ask
How does o3 perform?
We hold 4 charts that show o3, posted between Feb 2025 and Feb 2026, 0 of them from OpenAI. The most seen is "AI model task time trends" by METR with 113,083 views.
o3 vs Grok 4: which is better?
2 charts put them side by side. Which wins depends on the benchmark; each chart shows its own test and who published it.
Who publishes o3 benchmark charts?
METR, Epoch AI, Artificial Analysis, OpenAI, @arena, @EpochAIResearch, @ArtificialAnlys, @AnthropicAI, @deepseek_ai, @METR_Evals