
AI coding study results
METR's annotated chart drew 180.6K views on X: 1.2x its typical post and #12 of 26 METR charts we track by views. Read Oct 10, 2026.
Since early 2025, we've been studying how AI tools impact productivity among developers. Previously, we found a 20% slowdown. That finding is now outdated. Speedups now seem likely, but changes in developer behavior make our new results unr
Why it spread
It spread because a trusted evaluation account publicly retired its own earlier finding of a 20% slowdown and said speedups now seem likely, drawing 776 likes, 100 reposts, 45 quotes, 237 saves and 180,574 views.
What worked
- The post leads with a reversal of the account's own prior result, which gives readers a concrete before and after rather than a fresh claim.
- It is unusually well self labelled and branded, with a visible source line, so viewers can tell who is speaking and where the evidence comes from.
- It pairs a striking headline with an explicit caveat that selection effects make the new results unreliable, which invites quotes and saves rather than quiet scrolling.
What to borrow
We could frame our next chart as a correction of our own earlier number, state the old figure and the new direction plainly, and label the chart and source line so the caveat travels with the image.
Careful
Do not copy the reversal for its own sake or over read the engagement as proof that the new speedup finding is solid, since the post itself says the results are unreliable.
Written by our analysis model from the measured numbers above, not by METR.
Make it yours
Your numbers, in this table chart.
Starts from the real numbers of "Late-2025 AI likely accelerates open-source developers, but selection effects make our fol" by METR. Replace every number with yours before you post. Make one like this, step by step
Free pictures carry a small "Made with ViralChart" line. That line is how other people find us.
API · Max
Use this chart via API
On the Max plan you can pull this chart's numbers with the provenance of each one, as JSON or CSV, with its redraw spec, or call it from an agent over MCP. Chart id 923c56962861.
| Path | Returns | Plan | |
|---|---|---|---|
| GET | /api/v1/charts/923c56962861 | Title, publisher, date, form, point count; with a Max key, the data link | Open |
| GET | /api/v1/charts/923c56962861/data | Every point with its provenance and confidence, plus the redraw spec. Add ?format=csv for CSV | Max |
| GET | /api/v1/charts/923c56962861/render?view=1 | The draw-only view this page uses | Open |
| POST | /mcp | Tool get_chart_data with this id, for Claude, Cursor and other agents | Max |
curl -s https://viral-chart.com/api/v1/charts/923c56962861/data \
-H "Authorization: Bearer $VIRALCHART_KEY"claude mcp add --transport http viralchart https://viral-chart.com/mcp \
--header "Authorization: Bearer $VIRALCHART_KEY"60 requests a minute per key; over that you get 429 with Retry-After. Up to 5 keys per account, made on your account page and shown once. Without Max, the data route answers 402 with a link to the plans. The numbers describe a chart its publisher owns, and every file carries a license note.
More from METR
All 26
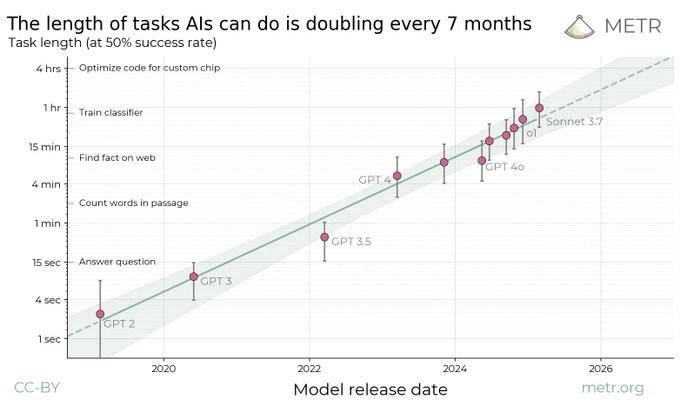


Other giants using a annotated chart
All 102



Questions people ask
How far did METR's "AI coding study results" chart travel?
180,574 views, 776 likes, 100 reposts and 237 saves on X, read Oct 10, 2026. A normal post from @METR_Evals gets about 153K views.
What kind of chart is it?
A annotated chart. Late-2025 AI likely accelerates open-source work, but selection effects make results unreliable.
Can I use METR's chart?
Use the format, not the picture. The chart, logo and design belong to METR. ViralChart redraws the chart type with your numbers and words, and credits the original publisher.