
AI model benchmark comparison
DeepSeek's table chart drew 7.1M views on X: 11x its typical post and #2 of 4 DeepSeek charts we track by views. Read Oct 19, 2026.
🚀 DeepSeek-V4.1-Flash-1017 is here!
Why it spread
This chart post spread because the launch timing landed with a large existing audience and drove unusually heavy quoting, reaching 2,135,584 views, 20,160 likes, 2,404 reposts, 1,737 quotes, and 3,294 saves, which is 5.3x the account's typical likes of 3,829.
What worked
- The post pairs a clear product launch message with a table comparing model performance across benchmarks, giving people a concrete reason to share.
- The quote rate sits in the top quarter, so the chart gave many people something specific to react to and discuss rather than just an announcement.
- The account's source reach is in the top quarter, meaning the post reached beyond its usual audience instead of staying contained.
What to borrow
We could use a simple table to compare our own models or tools across a few benchmarks, then tie it to a launch moment so the comparison feels timely and worth quoting.
Careful
Do not copy the low design polish or the missing source line, and do not assume the numbers alone caused the spread since the launch timing and the account's large reach also played a role.
Written by our analysis model from the measured numbers above, not by DeepSeek.
Make it yours
We have not read this chart's numbers yet
Its own maker appears here once its numbers are read. Until then, these are other real charts in a similar format: each data page starts from that chart's numbers and takes yours.
API
Not in the API yet
We have not read this chart's numbers yet, so the API has nothing to return for it. Charts with numbers read are on the data page, and each one can be called by id.
More from DeepSeek
All 4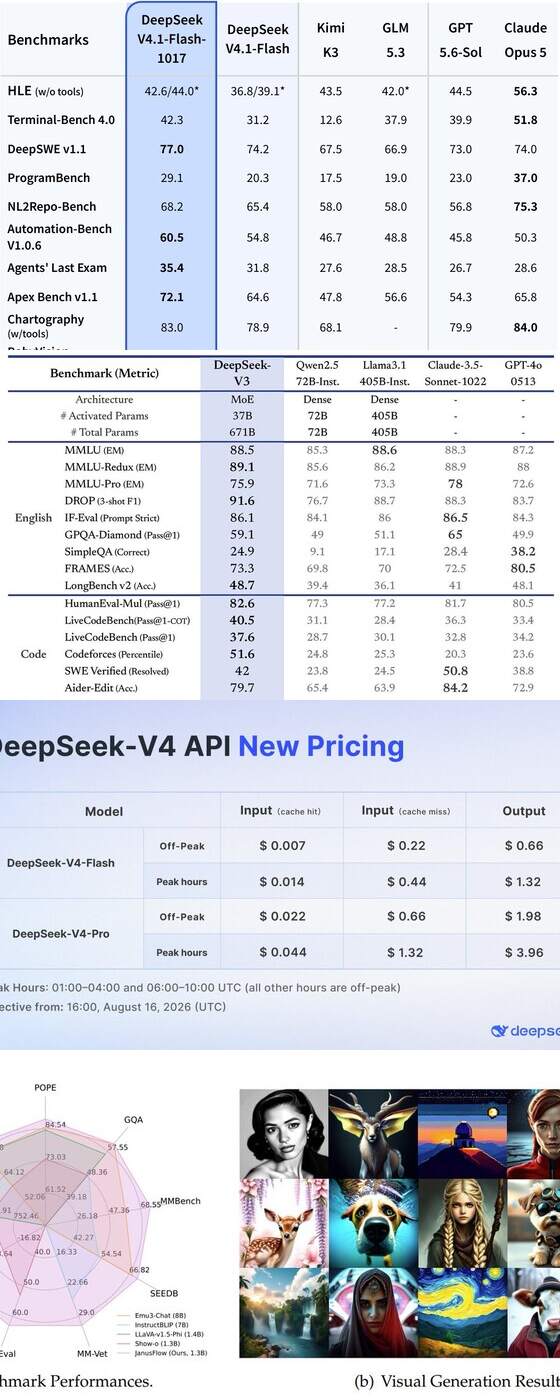
Other giants using a table chart
All 84








Questions people ask
How far did DeepSeek's "AI model benchmark comparison" chart travel?
7,080,134 views, 36,448 likes, 4,080 reposts and 6,933 saves on X, read Oct 19, 2026. A normal post from @deepseek_ai gets about 625.6K views.
What kind of chart is it?
A table chart. Comparison of AI model performance across various benchmarks.
Can I use DeepSeek's chart?
Use the format, not the picture. The chart, logo and design belong to DeepSeek. ViralChart redraws the chart type with your numbers and words, and credits the original publisher.