News · Feb 21, 2024
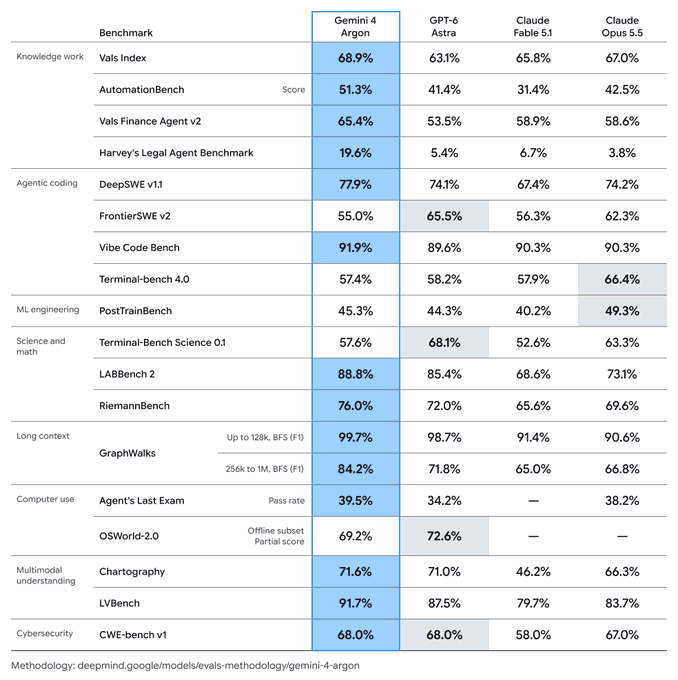
Google posts Gemma and Llama benchmark table chart
A single table chart comparing Gemma 7B and Llama-2 models drew 147K views but a 0.32% engagement rate.
What happened
Google posted a table chart on February 21, 2024, comparing Gemma and Llama models on benchmark scores. It was the account's only post that day.
The numbers
It reached 147K views, ranking #317 of 1,162 AI chart posts by views and #7 of 22 Google posts. Its score rank is #631 of 1,162 AI chart posts.
The lesson
A table chart with 3 models drew 147K views but a 0.32% engagement rate, 11th percentile among AI chart posts. The 0.026% save rate shows the table format did not convert views into saves.
What it means
At #15 of 22 Google posts by score, this chart trails the account's own median engagement of 0.67%. The 2x views lead over Google's 73.2K median came with a 0.32% engagement rate below the 0.73% AI chart median.
Written by ViralChart from public numbers read on Oct 13, 2026. Every number is checked against our data before it is shown.