News · Apr 28, 2025
Qwen posts benchmark table chart with 2.2M views
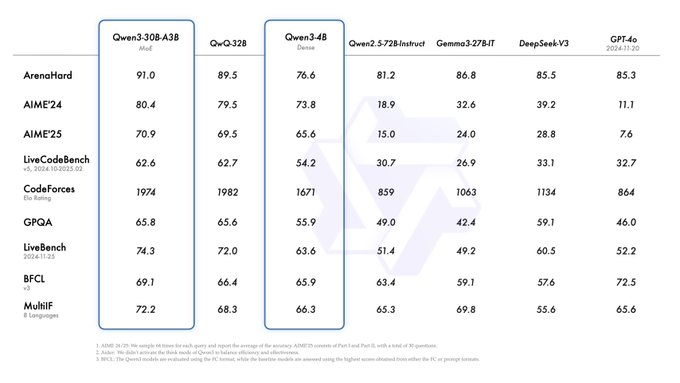
The April 28, 2025 table chart shows AI model performance across multiple benchmarks and drew 2.2M views against a 39.9K median among AI chart posts.
What happened
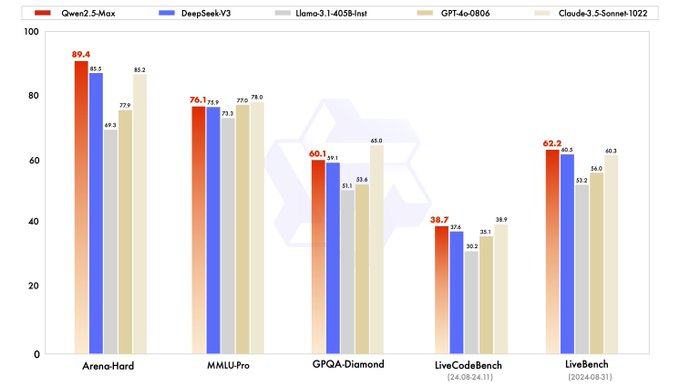
Qwen posted a table chart on April 28, 2025, comparing AI model performance across multiple benchmarks. The post included 2 charts, and Qwen published 1 post that day.
The numbers
It reached 2.2M views, ranking #57 of 1,162 AI chart posts by views and #9 of 55 Qwen posts. Its score of 79 ranks #60 of 1,162 AI chart posts.
The lesson
A table chart with 7 models shown reached 2.2M views, but its 0.47% engagement rate sits below the AI chart median. Wide reach and thin engagement can travel together.
What it means
At #16 of 55 Qwen posts by score, this chart trails the account's top posts despite 2.2M views. The 8.1x gap over Qwen's median views shows reach without matching engagement.
Written by ViralChart from public numbers read on Oct 13, 2026. Every number is checked against our data before it is shown.