News · Feb 3, 2026
Qwen scatter plot of AI model performance vs size draws 1.5M views
A single scatter plot from Qwen on February 3, 2026 drew 1.5M views and a 0.45% engagement rate, landing in the Wide but thin quadrant.
What happened
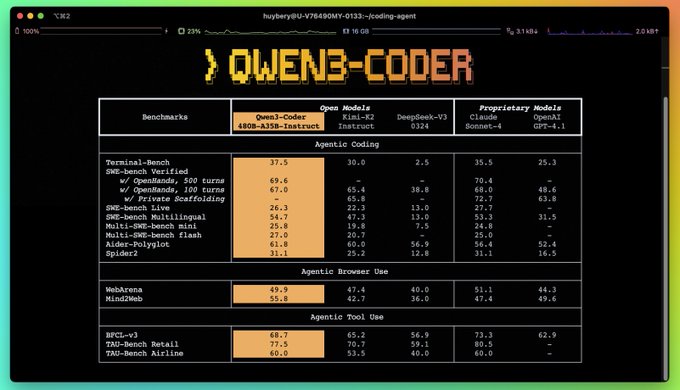
Qwen posted a scatter plot on AI model performance vs size on February 3, 2026. That day the account posted 2 posts, the other on performance on coding agent benchmarks at 45.6K views.
The numbers
The post drew 1.5M views, #74 of 1,162 AI chart posts, against a median of 39.9K views among AI chart posts. Its score of 82 ranks #29 of 1,162 AI chart posts and #13 of 55 Qwen posts.
The lesson
One scatter plot with 7 models shown drew 1.5M views, but a 0.16% save rate against a 0.45% engagement rate shows wide reach with thin saving. The chart shows SWE-Bench Pro Performance (%) values of 44.5%, 42.2% and 41%.
What it means
At #13 of 55 Qwen posts by score and #10 of 55 by views, this chart post sits above the account's own median of 275K views. The 0.16% save rate against the 0.45% engagement rate marks the gap between reach and saving for this publisher's chart posts.
Written by ViralChart from public numbers read on Oct 13, 2026. Every number is checked against our data before it is shown.