News · Oct 6, 2025
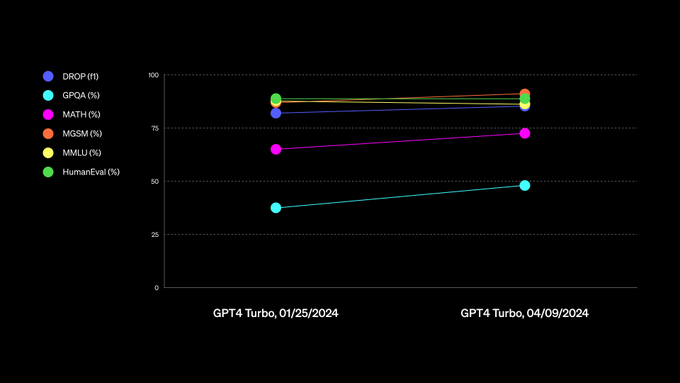
OpenAI posts API health timeline chart
A timeline of API service health drew 417K views but an engagement rate of 0.21%, below the AI chart median.
What happened
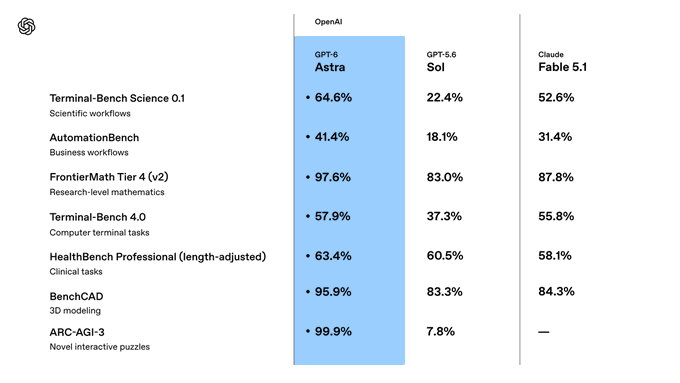
OpenAI published a timeline chart on October 6, 2025 covering API service health and performance. That day the account posted 2 posts, including one on GPQA Diamond PhD-level science questions with 476K views.
The numbers
It reached 417K views, #172 of 1,162 AI chart posts by views and #19 of 74 OpenAI posts. Its score of 59 ranks #461 of 1,162 AI chart posts.
The lesson
At 0.21% engagement against a 0.73% median among AI chart posts, this timeline drew views without matching the median save-and-like rate. A chart that carries a status update can travel on reach while its engagement rate stays in the bottom decile.
What it means
For OpenAI, 417K views is 2.6x its own 162K median, yet the score rank of #461 of 1,162 AI chart posts trails the views rank of #172. The gap between reach and engagement is where this publisher's chart posts lose ground.
Written by ViralChart from public numbers read on Oct 13, 2026. Every number is checked against our data before it is shown.