News · Apr 12, 2024 · Lead story
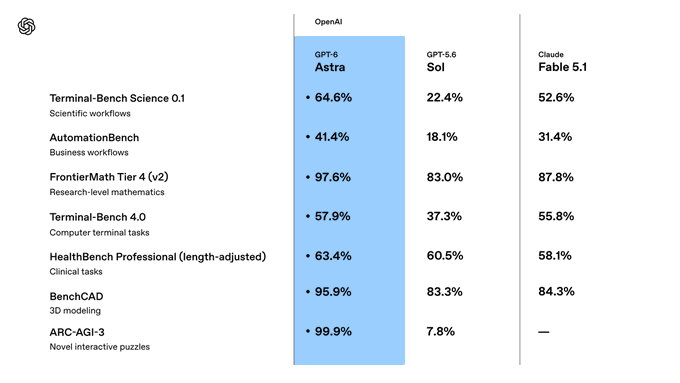
OpenAI posts GPT4 Turbo benchmark slope chart
The April 12, 2024 slope chart shows GPT4 Turbo performance across benchmarks over time, drawing 6.4M views against a 39.9K median among AI chart posts.
What happened
OpenAI published a slope chart on April 12, 2024, titled GPT4 Turbo Benchmark Comparison. It was the only post from this account that day.
The numbers
It reached 6.4M views, ranking #24 of 1,162 AI chart posts by views and #3 of 74 OpenAI posts. Its score of 69 ranks #237 of 1,162 AI chart posts.
The lesson
A single-model slope chart drew 6.4M views, 40x OpenAI's median post, but its 0.14% engagement rate sits at the 3rd percentile among AI chart posts. The chart type and one-model focus did not convert that reach into likes, reposts, quotes or replies.
What it means
For OpenAI, this post ranks #3 of 74 OpenAI posts by views but #17 of 74 by score, a gap between reach and measured engagement. Among all AI chart posts, its 0.14% engagement rate is below the 0.73% median.
Written by ViralChart from public numbers read on Oct 13, 2026. Every number is checked against our data before it is shown.