
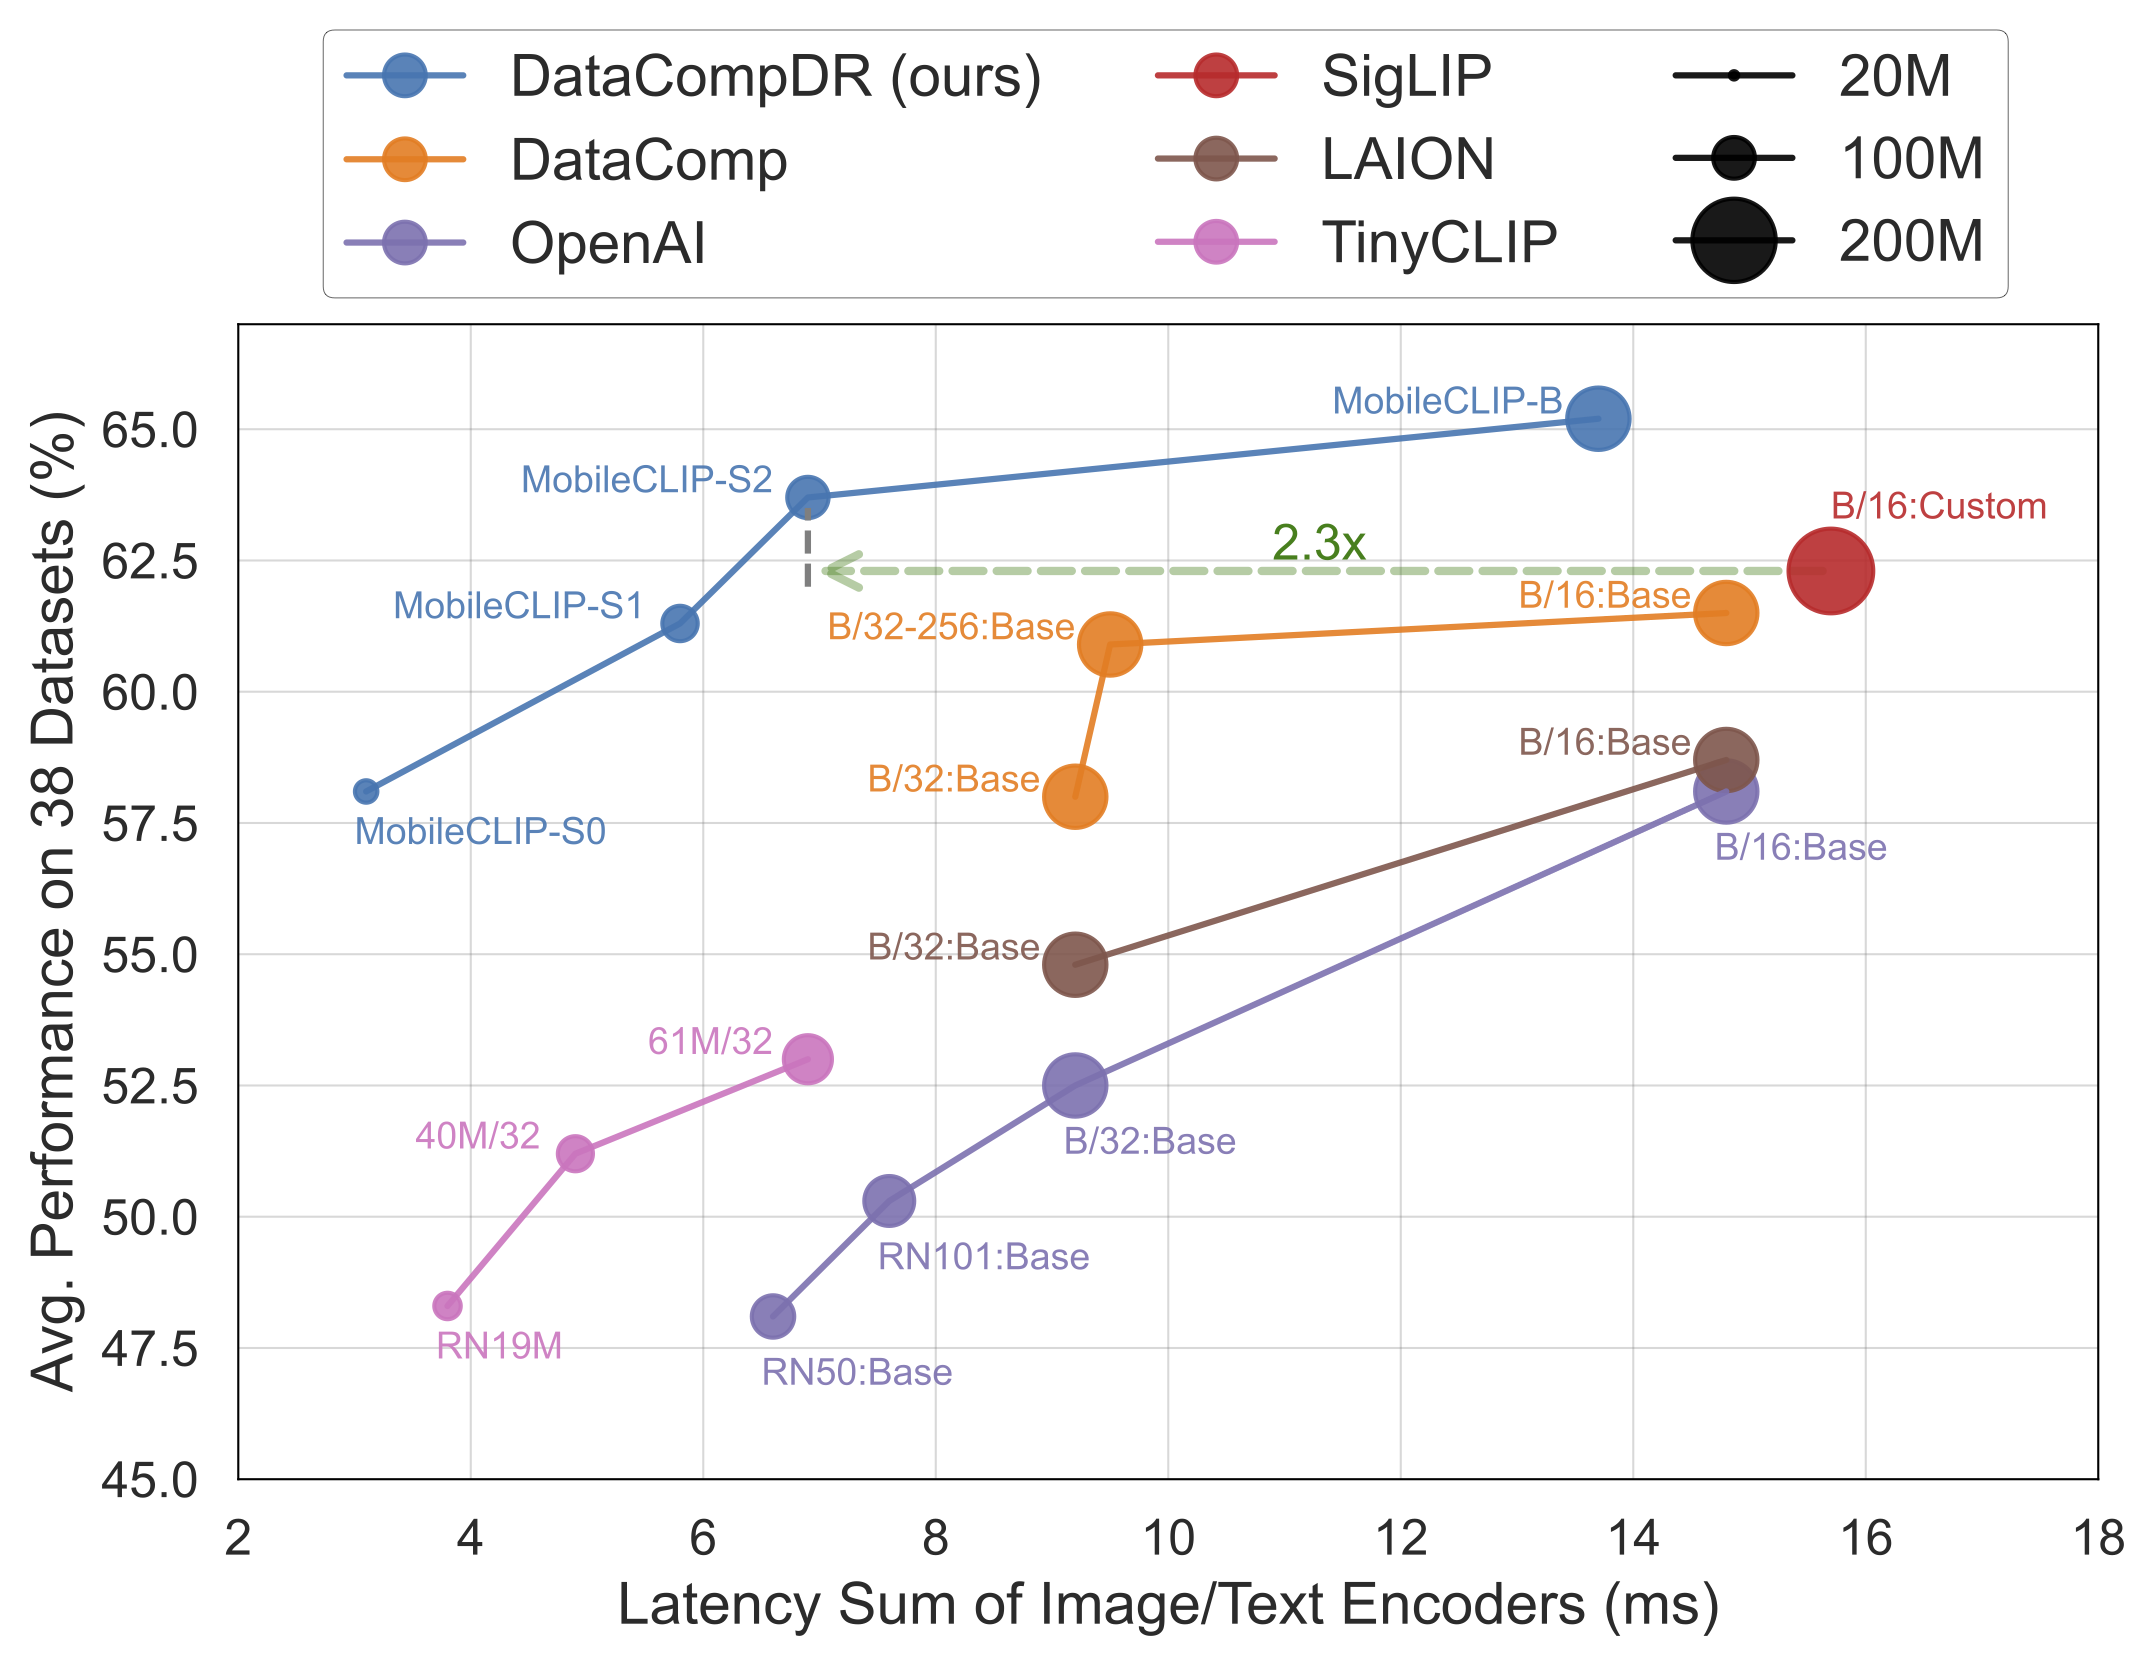
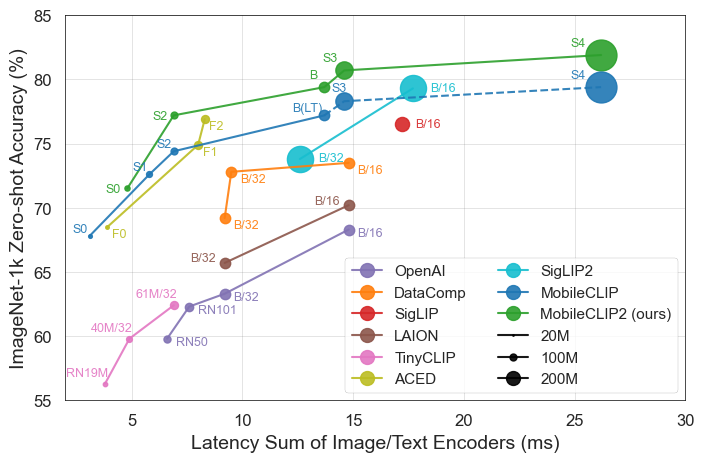
Model Performance vs Latency
FastViTHD achieves 3.2x speedup over ConvNeXt-L
API · Max
Use this chart via API
On the Max plan you can pull this chart's numbers with the provenance of each one, as JSON or CSV, with its redraw spec, or call it from an agent over MCP. Chart id d5196b39af53.
| Path | Returns | Plan | |
|---|---|---|---|
| GET | /api/v1/charts/d5196b39af53 | Title, publisher, date, form, point count; with a Max key, the data link | Open |
| GET | /api/v1/charts/d5196b39af53/data | Every point with its provenance and confidence, plus the redraw spec. Add ?format=csv for CSV | Max |
| GET | /api/v1/charts/d5196b39af53/render?view=1 | The draw-only view this page uses | Open |
| POST | /mcp | Tool get_chart_data with this id, for Claude, Cursor and other agents | Max |
curl -s https://viral-chart.com/api/v1/charts/d5196b39af53/data \
-H "Authorization: Bearer $VIRALCHART_KEY"claude mcp add --transport http viralchart https://viral-chart.com/mcp \
--header "Authorization: Bearer $VIRALCHART_KEY"60 requests a minute per key; over that you get 429 with Retry-After. Up to 5 keys per account, made on your account page and shown once. Without Max, the data route answers 402 with a link to the plans. The numbers describe a chart its publisher owns, and every file carries a license note.
Chart data
The numbers behind it
13 points. Estimated from the image Redrawn natively, with a way to make one with your own numbers.
More charts about FastVLM, MobileCLIP and Apple vision models
More from Apple

Questions people ask
Where does this chart come from?
Apple published it on Sep 3, 2025 on Hugging Face (huggingface.co). We keep it here, with the publisher and date credited as text, so you can study it without leaving.
Can I make a chart like this?
Use the format, not the picture. Open its data page and use Make one like this: it starts from this chart's numbers and takes yours.