News · Jul 30, 2026
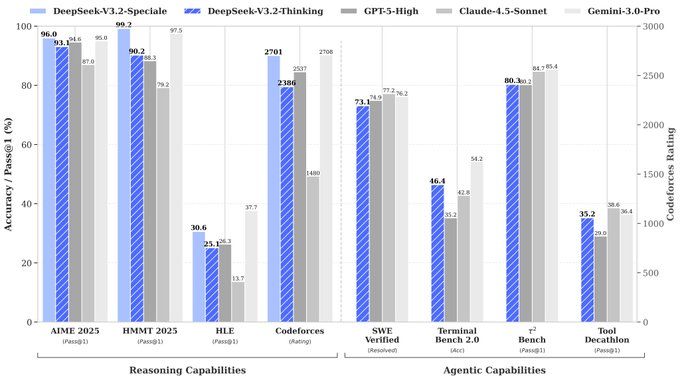
@ArtificialAnlys posts Artificial Analysis Coding Index bar chart
The bar chart drew 1.6K views and a 0.68% engagement rate, with saves at the 88th percentile among AI chart posts.
What happened
@ArtificialAnlys published a bar chart on the Artificial Analysis Coding Index on July 30, 2026. It came with 3 other posts from the account that day, the largest at 35.6K views.
The numbers
The post reached 1.6K views, ranking #1,102 of 1,162 AI chart posts and #448 of 491 @ArtificialAnlys posts. Its score of 23 ranks #1,038 of 1,162 AI chart posts.
The lesson
A 0.19% save rate at the 88th percentile among AI chart posts shows this bar chart was kept at a rate above the 0.076% median. The 1.6K views against a 39.9K median among AI chart posts show the saves came on a small view base.
What it means
At #399 of 491 @ArtificialAnlys posts by score, this chart sits below the account's own body of work. The 0.14x gap to the account's 11.4K median views is the measured distance for this publisher's chart posts.
Written by ViralChart from public numbers read on Oct 12, 2026. Every number is checked against our data before it is shown.