News · Jun 24, 2025
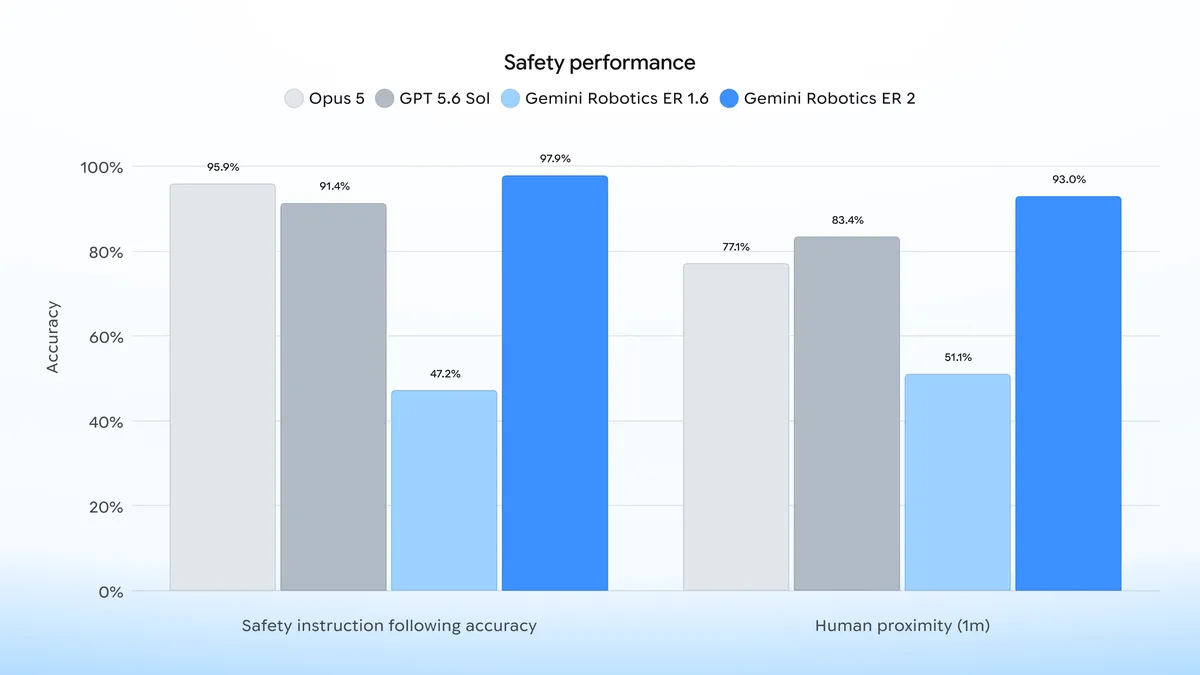
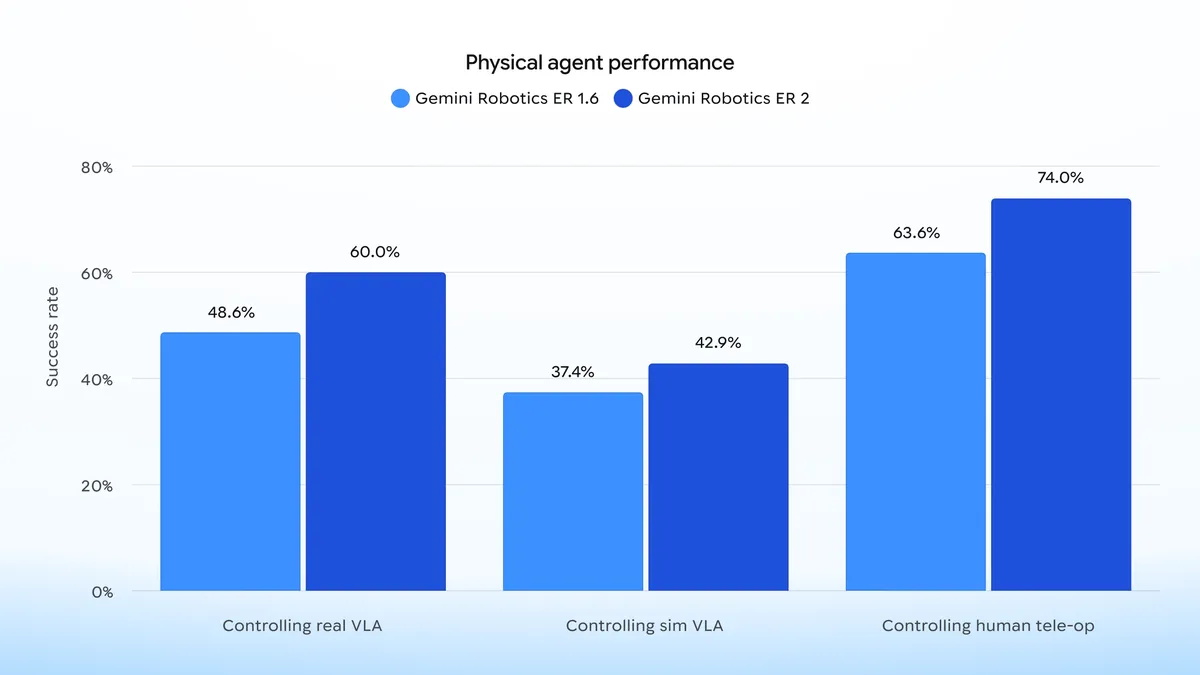
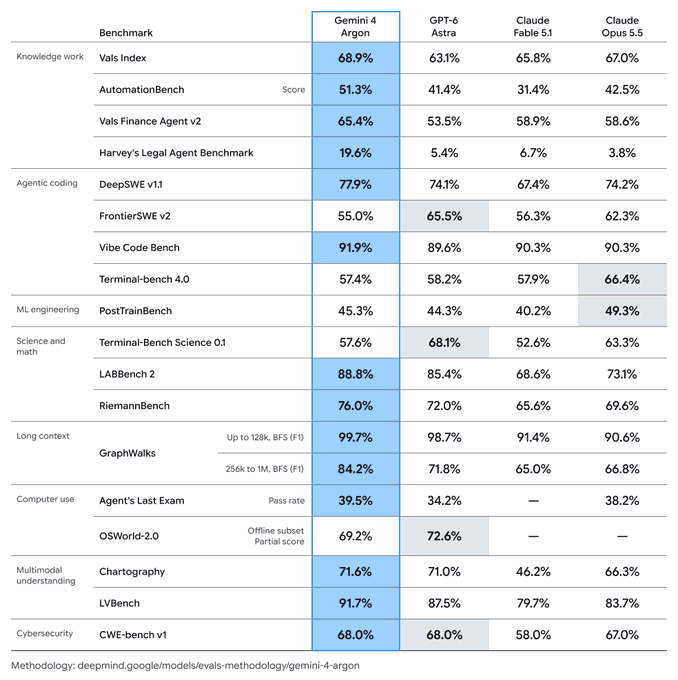
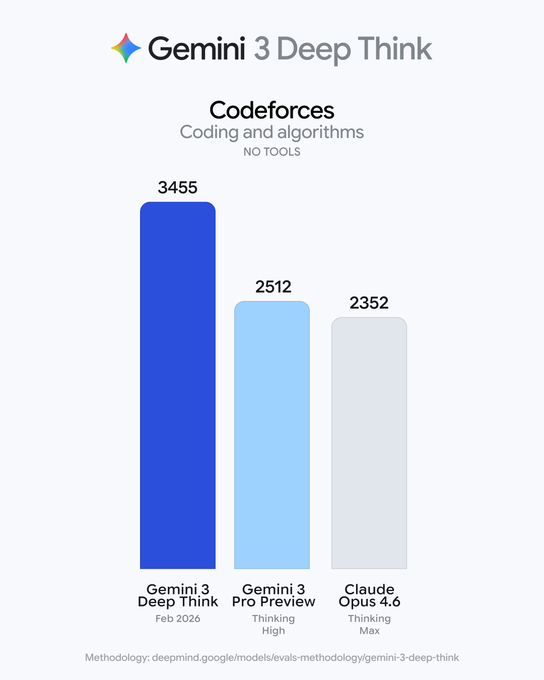
Google posts generalization benchmark chart across 9 tasks
A grouped bar chart of generalization benchmark results drew 12.2K views and a 1.59% engagement rate, with saves at 0.16%.
What happened
Google published a grouped bar chart on June 24, 2025, covering generalization benchmark results across 9 tasks, alongside an Instruction Following Benchmark chart. It was the account's only post that day.
The numbers
It reached 12.2K views, #790 of 1,162 AI chart posts, and #22 of 22 Google posts. Its score of 52 ranks #591 of 1,162 AI chart posts and #14 of 22 Google posts.
The lesson
A 1.59% engagement rate at the 93rd percentile shows readers engaged with this grouped bar chart even at 12.2K views. The 0.16% save rate sits below that engagement, so the chart drew reactions rather than saves.
What it means
At #22 of 22 Google posts by views, this chart trails the account's 73.2K median by 0.17x. Its 93rd percentile engagement rate against a 0.73% median shows the gap is in reach, not in response.
Written by ViralChart from public numbers read on Oct 12, 2026. Every number is checked against our data before it is shown.